
Share Market Toolbox

|
Brainy's Share Market Toolbox |
 |
Public Presentations |
|
 |
Robert has delivered a number of presentations to various audiences, including: the Australian Investors Association (AIA) Melbourne, and AIA Conference (2015), U3A (Manningham, Melb), and U3A Nunawading, VectorVest User Group (Melb), ASA (Australian Shareholders Association) Melbourne, Melbourne PC User Group (WASINT SIG), and a number of chapters of the ATAA - Melbourne, Sydney, Perth, Canberra, Newcastle (Australian Technical Analysts Association). Looking for a specific investing/trading topic? Try the Toolbox Master Index. PLEASE NOTE: The information and tools provided here are supplied in good faith, and no guarantee is made as to their accuracy or reliability, and no liability can be accepted for their use or misuse. |
Testimonials See what people have to say about Robert's presentations to various groups. Also see: Sensible Investing, Contrarian Investing Redefined, Funda-Technical Analysis. |
You are here: Share Market Toolbox > Members Gateway > Public Presentations Related links: Toolbox Master Index, eBook Articles Master List, Misc docs, Share Trading Tools Premium Members Gateway, Why Join as Toolbox Member?, Toolbox How To Join |
Table of ContentsOr jump to more details below |
||
INVESTING in the Share Market |
More INVESTING in the Share Market |
Technical Analysis and
|
| Share
Market 101 (aka Boot Camp) (2019-01a) This 2-hour presentation is a cut down version of the full 6-hour seminar, prepared especially for the U3A Nunawading Summer School. How much money do I need? (2020-02b) The second in a series of topics on "Trading Insights", presented to the Melbourne ATAA early in 2020. Medium Term Investing in Today's Awkward Markets (2016-06) Some of the challenges in today's investing climate, and some ways to address them. The Perils of Long Term (buy and hold) Investing (2017-02) Take a look at a few examples of high profile stocks and blue chips that have suffered from significant share price falls. And learn about some ways to help guard against these risks. Psychology and Emotions of Investing and Trading (2013-07c) An introduction to this difficult topic relating to the psychology and emotions of investing, and introducing some strategies to overcome them. Sharemarket 101 - Avoiding the Pitfalls to Make Good Profits (2013-02) Describing some of the common investing pitfalls, and identifying some of the furphies to be aware of. This presentation was recorded (at Box Hill Library) and the video recording is also available. (Robert classifies some Share Market GEMs as furphies. Also see the presentation below on Share Market GEMs.) 10 Key Lessons from the Global Financial Crisis (2012-02) Explanation of ten key lessons that we can learn from the GFC of 2008-2009, the effects of which impacted on many investors' porfolios for years. Investing Tips and Share Market Success Secrets (2014-09-2) Some investing tips and hints to help you be more successful. How to Preserve Capital and Minimise Losses (2011-09) Explaining that blue chip stocks can be disappointing, and how to sleep at night with open positions in the market, and considerations for managing the associated risks in the markets. Brainy's Share Market GEMs (2011-03) A discussion of many of the Wall Street cliches (words of wisdom), and where some of them are actually furphies. The Impacts of a Bear Market (2011-07a) How bad can a bear market really be? Especially if we buy and hold. How to Avoid the Next Bear Market (anti-decimation) (2011-07b) Some of the ways to spot and avoid a bear market. How to Avoid the Next GFC and Bear Market (2013-07b) This presentation is an update of an earlier one, and explains some ways to avoid falling victim in a bear market (or even in a significant market correction). What would you do? How good is your investing judgement? (2014-09-1) This presentation shows several price charts and offers the question: "would you be happy to buy this stock now?" |
Trading
Insights (2020-03) The first of a series of sessions presented to the Melbourne ATAA group on topics such as: (a) What to trade? (b) How much money do I need? Dividend Harvesting update (2020-07) An update to the earlier presentation on this topic, but this time detailing the results of four short term investments, made with the sole intention of taking the pending dividend with no capital loss. It didn't quite work out that way, and the results might surprise you. Dividend Harvesting (2019-11) A good discussion about how to go about finding shares paying good dividends, and trying to avoid capital loss at the same time. Searching for a strategy (2019-09) Some clues and tips when looking for tips and ideas for a trading or investing strategy. Trend Trading ASX Shares (2019-01c, and 2018-05) Some of the finer things to be aware of when Trend Trading shares on the Australian share market, so that anyone without a concrete strategy can study the details and understand what is involved. Nimble Short Term Investing (2015-08) (and the very first version - 2014-11) Identifying some of the shortfalls of the traditional investing methods, and discusings the Nimble Short Term Investing approach. This presentation was delivered to the 2015 AIA Conference on the Gold Coast. Nimble Short Term Investing and Today's Stock Picks (2015-02) An earlier version of the presentation above, identifying some of the shortfalls of the traditional investing methods, and discussing the Nimble Short Term Investing approach, but also including some stocks currently being "watched". The Trader's Journey (2014-03-01) This presentation describes one particular journey that an investor had taken, and which prompted the investor to become more short-term. As it happens, this story is very common amongst investors. Santa Rally - Fact or Fiction? - The Real Truth (2014-01-sr) Is there really such a thing as the "Santa Rally"? If so, exactly what is it? These questions are tackled in this presentation. How to Rank Stocks (and sectors) by Performance (2014-04) This presentation explains one way to identify potentially successful stocks, and how to sort them into a logical order. Useful Tips for Managing Risk (2012-04) Two presentations offer useful information about how to manage risk in the markets, including consideration of small cap companies (which tend to suffer from low liquidity) and high debt stocks. Effective Position Sizing (2014-03-02) To help optimise the profits form investing (and to reduce any losses), there are ways to calculate the optimum position size. In a falling market (eg. a bear market) should we keep stocks for the dividends? or sell? (2013-08) This presentation is an update of an earlier one which looks at a realistic portfolio of stocks and examines the damage to the portfolio value that can result from holding stocks during a bear market. Trading in Practise (2016-04) and also 2015-07 These two sets of slides has been used to lead and facilitate a workshop discussion, covering topics including: Trade planning using a Trading Work Sheet, Specifying portfolio and risk management metrics, Choosing a Stop Loss, Looking for a Target Price, Calculating Position Size (using the "2 Percent Rule"), and Setting Trailing Stops. |
Price
charts - unlocking the secrets (Technical Analysis)
(2019-01b) A 2-hour session overview of technical analysis, to help the average investor understand what it is and how to use it. Technical Analysis - What is it really? (2014-08) An overview of technical analysis, to help the average investor understand what it is and how to use it. Also see more information about technical analysis. Candlesticks, Stop Loss and Contrarian Investing (2011-06) An introduction to candlesticks, and to the notion of using a Stop Loss to protect capital. Contrarian Investing is also discussed. (See more on Candlesticks.) Ranking stocks using bullish chart indicators (2017-11) This presentation describes how to make bullish observations of chart indicators, and apply a rank value to sort the list by "degree of bullishness". Chart Patterns (2016-05) A presentation to the BullCharts User Group which summarises the range of technical analysis chart patterns to help users be aware of the variety, and how to identify them. Exit Strategies (updated) (2015-11 ) (also earlier version: 2014-10) This presentation describes a number of the more popular (ie. more common) approaches used by traders and investors to identify likely situations to consider exiting a position. (See more on Exit Strategies.) Analysing and annotating the price charts (2014-11-2) This presentation explains some chart analysis techniques, and how to record the observations on the price chart in charting software to help quickly use it again later. TradeSim software for back-testing (with BullCharts) (2016-10) Two presentations that provide an introduction to the topic of back-testing, and a demonstration of using the TradeSim software with BullCharts to conduct back-testing. (Back-testing is the relatively quick process of testing an investing / trading strategy over a period of time.) 2014 - Market Outlook (2014-01-mo) This presentation discusses one analyst's observations of the market in anticipation of the year ahead. Where's the Market Going? - Using the "4 Windows" approach (2013-10) This presentation explores the "4 Windows" approach to analysing the markets and the price charts. Special insights into bullish observations of T.A. chart indicators, to help us rank stocks (2022-04) Wouldn’t it be good if we could take a list of stocks (that might be your own stock universe), and sort the list with the strongest performing stocks at top of the list? That is, sort by the most bullish and have the most bearish at the bottom. And then invest in these stocks in anticipation of the best price performance. |
The slide presentations and more(A) Free Slide Handouts(B) Slidesets for Regular Toolbox Members and (C) Slides + Speaker Notes for Premium Toolbox Members. |
||||
|
Toolbox Presentations
NOTE: If you have any trouble downloading the slide-sets, then
try: (a) in Microsoft Internet Explorer:- Right-click on the
desired image, then choose "Save Target As" to save the file on
your computer; ORBrief Synopsis (b) in Firefox:- Right-click on the desired image, then choose "Save Link As" to save the file. |
(A)
Free Slide Handouts Free presentation preview in "handout" form (mostly 3 slides per page) |
(B)
Toolbox Members* slides (2 slides per page) Click on the image to download the slides |
(C)
Slides
+
Speaker Notes For Toolbox Premium Members* (explanatory notes) Click on the image to download the slides |
2025 Upcoming
speaking engagements
Past speaking engagements 2025:
2024:
More details
More information on some of the topics covered in the
presentations:Other information to look for
Also look for these other tools and documents in the Toolbox Members Area:
And whatever you do,
beware of the sharks in the ocean! 
|
RECENT |
||||
|
This is an update to the presentation of July 2024. At the time of writing in 2025 there are more than 390 ETFs (Exchange Traded Funds) available for you to buy/sell on the Australian Securities Exchange (ASX) share market, offered by a number of ETF providers. However, when you study some of these ETFs you will find that many are not very liquid. This might not be an issue for some investors, but it is an issue for many investors and traders. In addition to this, several ETFs now pay a monthly or quarterly dividend. So, how do we find out which ones are tradeable / investable? Which ones are safe to play with? What sort of thematics do they follow? Who are the major ETF providers in Australia? Where can we go for more information? Which ones pay frequent dividends? In this session, Robert answers all of these questions about ETFs, and more. This presentation was delivered
to the Melbourne ATAA monthly meeting in September 2025 at the
Arcadia Hotel South Yarra, and simultaneously broadcast to an
online audience. A recording of the broadcast is available to
ATAA members in the ATAA website Resource Library.
[ref-2025-09]
|
Free Handout file size 3.7 MB 30 pages |
Members Slides file size 7.6 MB 90 slides on 45 pages See the first page(s) free |
Premium Member Slides + Speaker Notes (available soon) |
|
|
(aka: Should I have bought this stock?)
The purpose of this session/presentation is:
This presentation is based on a similar one in October 2024, and was presented to both the May 2025 ATAA Melbourne chapter online hybrid meeting (and broadcast via Zoom) and to the BullCharts User Group sessions in May. It is basically a workshop session that was designed to test your technical analysis knowledge and ability. In the slides we show a price chart (initially hiding the security name and recent price data), then invite you to contemplate whether we should have bought it or not. To help you decide we include a number of different technical analysis chart indicators. Then we reveal the stock and all recent price data. See all the details in the free
Handout PDF at right, or the Slide deck available for Toolbox
Members.
[ref-2025-05]
|
Free Handout file size 1.7 MB 14 pages |
Members Slides file size 4.5 MB 40 slides on 20 pages See the first page(s) free |
Premium Member Slides + Speaker Notes pending please revisit soon. |
|
|
Over the years I have prepared and presented a few variations of the topic: "Introduction to Technical Analysis", but going forward many people have no idea what Technical Analysis is, or what to do with it. So, this presentation is different - because it addresses the subject from the angle of investing in the share market, and to address the question: "How can investors invest in the share market and make good use of technical analysis?". In particular, this presentation
addresses the following questions:
Part 2 of the slide deck starts
at about Slide #80 and includes information on:
See all the details in the free
Handout PDF at right, or the Slide deck available for Toolbox
Members.
[ref-2025-04]
|
Free Handout file size 3.7 MB 42 pages |
Members Slides file size 5.8 MB 124 slides on 62 pages See the first page(s) free |
Premium Member Slides + Speaker Notes pending please revisit soon. |
|
2024 |
||||
|
At the time of writing there are more than 370 ETFs (Exchange Traded Funds) available for you to buy/sell on the Australian Securities Exchange (ASX) share market, offered by a number of ETF providers. However, when you study some of these ETFs you will find that many are not very liquid. This might not be an issue for some investors, but it is an issue for many investors and traders. So, how do we find out which ones are tradeable / investable? Which ones are safe to play with? What sort of thematics do they follow? Who are the major ETF providers in Australia? Where can we go for more information? In this session, Robert sets out to answer all of these questions about ETFs, and more. This presentation was delivered
to the Melbourne ATAA monthly meeting in July 2024 at the
Arcadia Hotel South Yarra, and simultaneously broadcast to an
online audience. A recording of the broadcast is available to
ATAA members in the ATAA website Resource Library.
[ref-2024-07]
|
Free Handout file size 2.8 MB 24 pages |
Members Slides file size 6.2 MB 70 slides on 35 pages See the first page(s) free |
Premium Member Slides + Speaker Notes  file size 5.4 MB 70 slides on 70 pages See the first page(s) free |
|
|
Is now the right time to buy into the market? Are any stocks worth buying right now? Should we use a market "Go/No-Go" filter to minimise risk? What is the best way to periodically review stocks and the market? There are literally thousands of different ways to answer these questions, and all of them can be right. In this session Robert describes what he calls his “4-Windows” method of analysis, including:
This presentation was delivered
to the Melbourne ATAA monthly meeting in February 2024 at the
Arcadia Hotel South Yarra, and simultaneously broadcast to an
online audience. A recording of the broadcast is available to
ATAA members on the ATAA website.
Note: In the live presentation
there were too many slides to show in the time available, but
all slides are included here.
[ref-2024-02]
|
Free Handout file size 3.4 MB 34 pages |
Members Slides file size 9 MB 102 slides on 51 pages See the first page(s) free |
Premium Member Slides + Speaker Notes  file size 8.8 MB 106 slides on 106 pages See the first page(s) free |
|
2023 |
||||
|
Many investors and
traders have a background or career in engineering,
mathematics or science, and in that field there is often just
one right answer in many situations. These people are used to
arriving at one correct solution to a problem, and they accept
that all other proffered solutions are likely to be wrong. This presentation was delivered
to the Melbourne ATAA monthly meeting in November 2023 at the
Arcadia Hotel South Yarra, and simultaneously broadcast to an
online audience. A recording of the broadcast is available to
ATAA members on the ATAA website.
[ref-2023-11]
|
Free Handout file size 2.4 MB 23 pages |
Members Slides file size 4.4 MB 68 slides on 34 pages See the first page(s) free |
Premium Member Slides + Speaker Notes  file size 4.9 MB 68 slides on 68 pages See the first page(s) free |
|
|
Twice each year, there are several weeks when many companies go ex-dividend and then deliver dividends to their investors. Some investors buy and hold stocks primarily to capture the dividend for periodic income over time, while some traders try to harvest the dividends by holding the stock short term around the ex-dividend date. There are problems with both of these strategies; but exactly what are the problems? What are the pros and cons of holding a stock for the dividend, either short term or long term? Did you know there are serious risks with either approach? Also, do you remember the broadly touted view that a stock’s share price will generally fall by the amount of the dividend? Well, that is absolute rubbish! It’s a complete furphy!! In this session we explore these issues, and in particular we take a close look at how the share price typically performs around the ex-dividend date, and touch on things like:
This presentation was delivered
to the Melbourne ATAA monthly meeting in June 2023 at the Auburn
Hotel, and simultaneously broadcast to an online audience. A
recording of the broadcast is available to ATAA members on the
ATAA website.
[ref-2023-06]
|
Free Handout file size 2.9 MB 26 pages |
Members Slides file size 9.3 MB 77 slides on 39 pages See the first page(s) free |
Premium Member Slides + Speaker Notes  file size 8.3 MB 108 slides on 108 pages See the first page(s) free |
|
|
This is an updated version of
the presentation in KL in July 2022 and in Melbourne in August
2022.
Many of us realise that one
candlestick on a share market price chart summarises the price
action in one period (a day, or week, or month, etc.). A single
candle can tell a story about the opinions of the real market
participants during that period.
In addition to this, two or
three (or more) consecutive candles can form a specific candle
pattern and tell us even more of a story. However, there are
lots of candle patterns, and each pattern has its own name.
So how can we go about learning
and recognising these many patterns? How can we utilise just a
small amount of knowledge about candle patterns to analyse many
possible patterns on the price chart? In this session Robert
explains a different approach to identifying and interpreting
candle patterns.
In July 2022 this was a brand
new presentation, based on bits and pieces from other
presentations (including the Technical Analysis Introduction).
It was prepared especially for presentation to the
ProTrader International Workshop in Kuala Lumpur in July 2022,
and it was tweaked for the Melbourne ATAA webinar on 11 August
2022.
[ref-2023-05]
|
Free Handout file size 1.6 MB 32 pages |
Members Slides file size 3.8 MB 95 slides on 48 pages See the first page free |
Premium Member Slides + Speaker Notes  file size 6.6 MB 95 slides on 95 pages See the first page(s) free |
|
|
How
to explain odd or unexpected share price movements?
February
2023
Have you ever observed odd or unexpected share price movements on the price charts and wondered what’s caused it? Or why there was a big move (either up or down) in recent days? In this presentation we look at:
[ref-2023-02]
|
Free Handout file size 3.5 MB 21 pages |
Members Slides file size 7.8 MB 62 slides on 31 pages |
Premium Member Slides + Speaker Notes  file size 8.5 MB 62 slides on 62 pages See the first page(s) free |
|
2022 |
||||
|
NOTE: This presentation has been
supplanted by an updated version above in
May 2023.
Many of us realise that one
candlestick on a share market price chart summarises the price
action in one period (a day, or week, or month, etc.). A single
candle can tell a story about the opinions of the real market
participants during that period.
In addition to this, two or
three (or more) consecutive candles can form a specific candle
pattern and tell us even more of a story. However, there are
lots of candle patterns, and each pattern has its own name.
So how can we go about learning
and recognising these many patterns? How can we utilise just a
small amount of knowledge about candle patterns to analyse many
possible patterns on the price chart? In this session Robert
explains a different approach to identifying and interpreting
candle patterns.
This is a brand new
presentation, based on bits and pieces from other presentations
(including the Technical Analysis Introduction). It was
prepared especially for presentation to the ProTrader
International Workshop in Kuala Lumpur in July 2022, and it was
tweaked for the Melbourne ATAA webinar on 11 August 2022.
[ref-2022-08b]
|
Free Handout file size 1.5 MB 28 pages |
Members Slides file size 4.3 MB 84 slides on 42 pages See the first page free |
Premium Member Slides + Speaker Notes  file size 5.7 MB 84 slides on 84 pages See the first page(s) free |
|
|
Does it surprise you to hear
that the 200 stocks in our XJO* “Top 200” index are NOT
literally the top 200 stocks in our market by market cap?
As at July 2022 they are actually selected from the top 349! This is explained in this presentation, with the following topics covered:
[ref-2022-08a]
|
Free Handout file size 2 MB 13 pages |
Members Slides file size 6.8 MB 36 slides on 18 pages See the first page free |
Premium Member Slides + Speaker Notes  file size 5.2 MB 39 slides on 39 pages See the first page(s) free |
|
|
This updated version of an earlier presentation now comprises a more complete discussion about stock liquidity, or lack of liquidity. It includes discussion on these items:
[ref-2022-07e]
|
Free Handout file size 1.3 MB 12 pages |
Members Slides file size 3.8 MB 34 slides on 17 pages See the first page(s) free |
Premium Member Slides + Speaker Notes  file size 2.5 MB 34 slides on 34 pages See the first page(s) free |
|
|
July 2022
When investing in the markets, it is important to liquidate some market positions at the appropriate time, in order to protect our investment capital and profits. But there are many different approaches to doing this, and many possible methods. This presentation provides an overview to the variety of different exit strategies that can be employed to protect our capital, including:
This presentation has been updated more than twice since the original presentation in November 2015, with the most recent update for the ProTrader International Workshop in Kuala Lumpur in July 2022. It has been presented to a couple of groups in recent years, and used to help provoke some ideas for exit strategies to share around the table, and to consider for inclusion in the BullCharts User Group $100k Hypothetical Portfolio. [ref-2022-07d]
|
Free
Handout file size 2 MB 19 pages |
Members
Slides file size 3.9MB 52 slides on 26 pages See the first page free |
Premium
Member Slides + Speaker Notes  file size 3.8MB 52 slides on 52 pages See the first page free |
|
|
July 2022
In 2019 I did some research into the pros and cons of dividend harvesting over several months, and prepared an initial presentation (in November) with an update in January 2020 (see below). In the first few months of 2020 I put a revised dividend harvesting strategy into practise, using up to $10,000 of an available $100,000. This presentation includes lots of key details and strategy conclusions. This presentation was delivered online to an audience of about 50 ATAA members and guests, and was recorded. After studying the pending dividend announcements every weekend for months in early 2020, I took four trades during the period from May 2020 to July, with the express purpose of capturing the dividend without capital loss. One trade was a good winner, and the other three trades all netted a good dividend amount, but lost capital - especially the trade where the stock had a special dividend and a stock consolidation with very little warning. See all of the details in the free handout notes and the slides (for members only) at right. Note that due to a time restriction for the delivery of this presentation in the online session, several slides and some commentary had to be omitted. However, all of the slides are included in the handout and slide set at right. This presentation is a tweaked version of the one from 2020, and was presented to the ProTrader International Workshop in Kuala Lumpur in July 2022. [ref-2022-07c]
|
Free Handout file size 1.5 MB 20 pages |
Members Slides file size 3.2 MB 56 slides on 28 pages See the first page(s) free |
Premium Member Slides + Speaker Notes (coming soon) |
|
|
This presentation has been supplanted by a tweaked version only a few weeks later, for presentation to the ATAA Melbourne webinar on 11 August. See the newer version above. [ref-2022-07b]
|
Free Handout |
Members Slides |
Premium Member Slides + Speaker Notes |
|
|
This session is an overview and
introduction to this difficult topic relating to the psychology
and emotions of investing, and introducing some strategies to
overcome them. Introducing the following topics:
[ref-2022-07a]
|
Free Handout file size 1.8 MB 24 pages |
Members Slides file size 1.8 MB 70 slides on 35 pages See the first page free |
Premium Member Slides + Speaker Notes  file size 7 MB 69 slides on 69 pages See the first page free |
|
|
This presentation to the ATAA Brisbane webinar was an updated version of the November 2015 presentation; but was tweaked again for presentation to the ProTrader International Convention in Kuala Lumpur in July 2022 (see the newer version above). [ref-2022-06d]
|
Free
Handout |
Members
Slides |
Premium
Member Slides + Speaker Notes |
|
|
This is a slightly tweaked version of the presentation from March 2014. When buying a parcel of shares, should we simply buy a round, say, $5000 or $10,000 worth? Should we consider buying a different sized parcel of shares each time? What are the considerations? Can we utilise sound risk management methods to minimise the risk? Can we in fact optimise the position size? The material in this presentation has been compiled over a couple of months, with discussion at the BullCharts User Group meetings. The presentation talks about two position sizing methods: "Fixed Dollar Amount" per trade, and "Fixed Risk Amount" per trade. The latter is based on the so-called "Two Percent Rule". Also see the web page on Optimising Position Sizing. The presentation includes a case study comparison of these two position size approaches, with one of them being a clear winner over the alternative. See the presentation slides at right for all the details. Note that the Premium Member's version includes additional explanatory comments. [ref-2022-06c]
|
Free
Handout file size 1.6 MB 10 pages |
Members
Slides file size 1.6 MB 28 slides on 14 pages See the first page free |
Premium
Member Slides + Speaker Notes  file size 4.4 MB 34 slides on 34 pages See the first page free |
|
|
How to preserve capital and minimise losses or: How to sleep at night - with maximum profits June 2022 This is a revised/tweaked version of the presentation I first presented in September 2011, and which covers two key topics:
[ref-2022-06b]
|
Free Handout file size 3.5 MB 22 pages |
Members Slides file size 6.2 MB 66 slides on 33 pages See the first page(s) free |
Premium Member Slides + Speaker Notes  file size 8 MB 67 slides on 67 pages |
|
|
April
2022
Wouldn’t it be good if we could take a list of stocks (that might be your own stock universe), and sort the list with the strongest performing stocks at top of the list? That is, sort by the most bullish and have the most bearish at the bottom. And then invest in these stocks in anticipation of the best price performance. BUT HOW to do this?? We could study bullish features of technical analysis chart indicators and allocate a ranking or score value and then sort the list. [ref-2022-04]
|
Free Handout file size 3.6 MB 39 pages |
Members Slides file size 10 MB 116 slides on 58 pages See the first page(s) free |
Premium Member Slides + Speaker Notes  file size 9.3 MB 116 slides on 116 pages See the first page(s) free |
|
2021 |
||||
|
What is the best way to choose stocks for purchase? Should we exclusively use either technical analysis, or fundamental analysis? Or a mixture? Or should we focus on a preferred market sector? Or perhaps choose a company that has a “good story” and hope they deliver? In early 2021 the BullCharts User Group members were playing a stock picking game, where each person was invited to nominate just one stock to hold in the game for a few weeks or months. Each member was invited to explain the details behind why they chose their stock. For a group of technical analysts the answers were very surprising, and might be indicative of why ATAA members, and in fact many retail traders/investors, invest/trade in the stocks that they do. In this session Robert shares the many reasons for stock selection that are in use among our colleagues and peers – which surprisingly include the use of both technical analysis and fundamental analysis to varying degrees. The information presented might give ATAA members, and retail investors in general, some comfort with their own stock selection ideas and methods, so it will be a very useful session to attend. [ref-2021-08]
|
Free Handout file size 1.5 MB 16 pages |
Members Slides file size 6 MB 48 slides on 24 pages See the first page(s) free |
Premium Member Slides + Speaker Notes  file size 3.8 MB 52 slides on 52 pages See the first page(s) free |
|
2020 |
||||
|
How do you manage to record the details of your technical analysis of the price charts? Do you draw trend lines and make notes and various annotations directly on the price chart on your computer? Do you end up with too many annotations and a cluttered chart? What about studies in different time frames such as daily and weekly, and what about studies of both the short term and long term? It can get rather messy and awkward. In this session Robert demonstrates many of the chart tools in BullCharts (eg. lines, measure tools, etc. – see the next page for a list), and several ways to keep on top of the clutter, so as to easily group like with like and only show the related items. This presentation is an advancement of Robert’s presentation from November 2014. The Premium Members Speaker Notes will be available very soon. [ref-2020-10]
|
Free Handout file size 2 MB 14 pages |
Members Slides file size 6 MB 40 slides on 21 pages See the first page(s) free |
Premium Member Slides + Speaker Notes (coming soon) |
|
|
This presentation has been supplanted by a tweaked version for delivery to the ProTrader International Workshop in Kuala Lumpur in July 2022. See the newer version of this presentation above. [ref-2020-07]
|
Free Handout |
Members Slides |
Premium Member Slides + Speaker Notes |
|
|
A few years ago I prepared a 1-day
seminar on this topic, comprising a 120-page handbook and many,
many slides. This seminar ran publicly for small groups over a
few years. I have now produced a summary set of slides, and
added a voice-over to produce a 60-minute YouTube video. Click to watch the video on YouTube.
The 60-minute video might be a little long for those people who
want to find out the basics in less than 10-minutes, so I have
also produced a 6-minute movie. Watch the 6-minute video here.You can download the slides at right, and you can watch both of the videos on YouTube. The topics that are briefly covered:
[ref-2020-04]
|
Free Handout file size 2 MB 26 pages |
Members Slides file size 5 MB 77 slides on 39 pages See the first page(s) free |
Premium Member Slides + Speaker Notes (coming soon) |
|
|
The Melbourne ATAA chapter has commenced presenting a series of presentation/workshop sessions entitled "Trading Insights". This is the second session in the series and considers: "How Much Money do I Need?" Focusing on the majority of financial market investors/traders, we assume here that we will look at trend trading equity markets. This results in some assumptions for:
[ref-2020-03-1b]
|
Free Handout file size 0.3 MB 8 pages |
Members Slides file size 0.3 MB 24 slides on 12 pages See the first page(s) free |
Premium Member Slides + Speaker Notes (coming soon) |
|
|
The Melbourne ATAA chapter has commenced presenting a series of presentation/workshop sessions entitled "Trading Insights". This is the first of several 20 minute sessions, to address the question: "What to Trade?" This addresses the concerns of newer investors and traders regarding the bewildering variety of instruments, asset classes and markets. There are many possibilities which make it difficult for the newcomer. They can choose from the following, plus more:
[ref-2020-03-1a]
|
Free Handout file size 0.5 MB 21 pages |
Members Slides file size 0.5 MB 63 slides on 32 pages See the first page(s) free |
Premium Member Slides + Speaker Notes (coming soon) |
|
|
I prepared a simple set of slides to lead a group discussion on the topic of Stock Liquidity at the February 2020 BullCharts User Group meeting. With a little enhancement this slide set is worth posting here for Toolbox Members and others. It includes some discussion about:
[ref-2020-02b]
|
Free Handout file size 1 MB 9 pages |
Members Slides file size 1 MB 26 slides on 13 pages See the first page(s) free |
Premium Member Slides + Speaker Notes  file size 1 MB 26 slides on 26 pages See the first page(s) free |
|
|
This session is simply a markets update, and touches on the following topics:
[ref-2020-02]
|
Free Handout file size 2.4 MB 23 pages |
Members Slides file size 4 MB 68 slides on 34 pages See the first page(s) free |
Premium Member Slides + Speaker Notes  file size 9 MB 69 slides on 69 pages See the first page(s) free |
|
|
Dividend Harvesting - January 2020 presented to: ATAA Melb (Jan 2020), BullCharts User Group (Sept), U3A (Nov) NOTE: This is an update to the same presentation a couple of months previously. Some of the slides have been revised. Interested in investing in dividends? Is it easy? Is it straight forward? Are there any catches? Isn't it easy to find a list of good dividend payers?, and then to buy-and-hold the stock for years? And to easily find the ex-dividend dates? And to simply follow the published dividend strategies? You might be very surprised at the real answers to these questions. In this session we:
[ref-2020-01]
|
Free Handout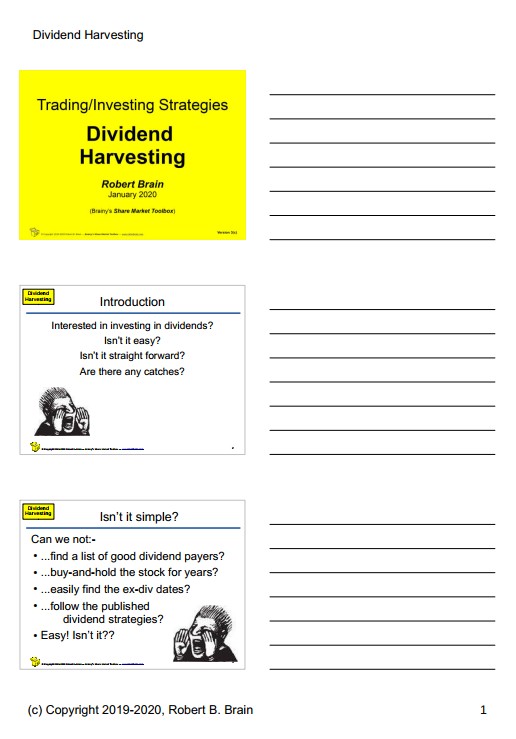 file size 1.5 MB 24 pages |
Members Slides file size 3.4 MB 72 slides on 36 pages See the first page(s) free |
Premium Member Slides + Speaker Notes  file size 3.3 MB 75 slides on 75 pages See the first page(s) free |
|
2019 |
||||
|
The share market price charts summarise the opinions of the real market participants. Every chart tells a story and it pays to understand the stories in the price charts. (This is the basis of Technical Analysis.) In this session in the ATAA Melbourne chapter meeting in December, we worked through the set of slides which includes some price charts of a particular stock (from a couple of months previously), and we talked about the stories in the price charts. We also looked at what some of the technical analysis indicators were telling us, and we drew a conclusion about whether we should have invested in this stock at the time. The final slides show the eventual share price performance and whether our hypothetical decision to invest was right or wrong. The "Slides + Speaker Notes" version (for Premium Toolbox members) can be used as a self-study by individuals. [ref-2019-12]
|
Free Handout file size 1 MB 14 pages |
Members Slides file size 1.7 MB 40 slides on 20 pages See the first page(s) free |
Premium Member Slides + Speaker Notes (available soon) |
|
|
NOTE: A more recent version of this presentation was delivered in January 2020 - see the item above. Interested in investing in dividends? Is it easy? Is it straight forward? Are there any catches? Isn't it easy to find a list of good dividend payers?, and then to buy-and-hold the stock for years? And to easily find the ex-dividend dates? And to simply follow the published dividend strategies? You might be very surprised at the real answers to these questions. In this session we:
[ref-2019-11]
|
Free Handout file size 1.5 MB 25 pages |
Members Slides file size 3 MB 73 slides on 37 pages See the first page(s) free |
Premium Member Slides + Speaker Notes  file size 3 MB 73 slides on 73 pages See the first page(s) free |
|
|
When starting out in the business of share trading or investing, many people are confused by the huge range of possible analysis methods and strategies. Even with experience, some traders who use discretionary analysis methods manage to overlook some basic principles. So, let’s go “back-to-basics”. Are you looking for trading ideas for your trading/investing strategy? Or how to go about it? Perhaps you are an advanced trader/investor and overlooking something? So looking for clues to tweak your strategies? These topics are addressed in this presentation, and the slides are designed to be used in a group discussion session so as to share experiences, but they contain enough information to be useful as they are. The "Slides + Speaker Notes" version (for Premium Toolbox members) can be used as a self-study by individuals. [ref-2019-09]
|
Free Handout file size 1 MB 14 pages |
Members Slides file size 2 MB 42 slides on 21 pages See the first page(s) free |
Premium Member Slides + Speaker Notes  file size 2 MB 42 slides on 42 pages See the first page(s) free |
|
|
A two hour crash course overview of the share market — what it is, how it works, who to believe, and the pitfalls to watch out for. This presentation is a 2-hour version of the original 6-hour Share Market Boot Camp, especially prepared for the U3A Nunawading Summer School in January 2019. The session covers the following topics:
[ref-2019-01a]
|
Free Handout file size 4.5 MB 52pages |
Members Slides file size 3.7 MB 155 slides on 78 pages See the first page free |
Premium Member Slides + Speaker Notes  file size 5.4 MB 155 slides on 155 pages See the first page free |
|
|
(aka
Technical Analysis)
U3A Nunawading Summer School - January 2019 Share market price charts summarise the underlying opinions and emotions of the real market participants. Every price chart tells a story, and it pays to understand the stories in the price charts. Why does the share price of a particular stock rise to a particular level, and then sell off, only to fall for a while and then start to rally again? This 2-hour session provides an introduction to the topic of how to “read the stories” in the price charts — the subject of Technical Analysis. This presentation is a 2-hour version of the original 6-hour seminar, especially prepared for the U3A Nunawading Summer School in January 2019. The session covers the following topics:
[ref-2019-01b]
|
Free Handout file size 2.8 MB 30 pages |
Members Slides file size 3.6 MB 90 slides on 45 pages See the first page free |
Premium Member Slides + Speaker Notes  file size 7.7 MB 90 slides on 90 pages See the first page free |
|
|
Many investors in the share market are what we call “trend traders”. How much money should you invest in any one company? How long should you hold it for? This 2-hour session explains how to “trend trade” the ASX shares, and the pitfalls to be aware of, and how to manage the risks. This presentation is a 2-hour version of the fairly new 1-hour session that was prepared in 2018 for the Australian Shareholders Association. This version was especially prepared for the U3A Nunawading Summer School in January 2019. The session covers the following topics:
[ref-2019-01c]
|
Free Handout file size 2.6 MB 28 pages (revised 17 Jan 2019) |
Members Slides file size 4.4 MB 86 slides on 43 pages Latest version is 3.2 Revised 17 Jan 2019. See the first page free |
Premium Member Slides + Speaker Notes  file size 5.8 MB 86 slides on 86 pages See the first page free |
|
2018 |
||||
|
This set of slides (updated from the earlier presentations in 2016) has been used to lead and facilitate a hands-on workshop discussion, utilising the Trading Worksheet handout document. The slides and "Speaker Notes" can be used as a self-study Case Study example, demonstrating the steps and decisions in position sizing, and managing risk. The session covers the following topics:
The "Slides + Speaker Notes" version (for Premium Toolbox members) can be used as a self-study by individuals. [ref-2018-10]
|
Free Handout file size 1.2MB 26 pages |
Members Slides file size 3MB 76 slides on 38 pages See the first page free |
Premium Member Slides + Speaker Notes  file size 3MB 76 slides on 76 pages See the first page free |
|
|
Are you thinking about actively trading or investing in the Australian share market? Whether it’s for short term trading (such as day trading), or longer term trading, or even investing, this presentation addresses many of the questions that come to mind. What type of person can do this? How much time does it take? Do I really need to prepare a strategy or system? How much money do I need to start with? How many shares to buy? Can I make money doing this? This presentation will be presented to the Australian Shareholders Association (ASA) Seminar day, "Share strategies to suit your investing style", in Melbourne on 24 August 2018. The Free Handout and Members Slides documents are now available (at right). The Speaker Notes will be completed and available at right very soon. The topics to be addressed in this 50 minute presentation include:
[ref-2018-08]
|
Free Handout file size 3MB 34 pages |
Members Slides file size 3MB 102 slides on 51 pages See the first page free |
Premium Member Slides + Speaker Notes  file size 8MB 102 slides on 102 pages See the first page free |
|
|
TradeSim for back-testing - INTRODUCTION June 2018 (a revised version of the October 2016 presentation) TradeSim is a software tool that is available as a plug-in for the BullCharts charting software system (and for MetaStock). This presentation was originally prepared for the Australian BullCharts User Group meeting in October 2016, and revised for the June 2018 meetings. It provides an overview of TradeSim and how it works. Also see the Case Study example below. [ref-2018-06]
|
Free Handout file size 200 kB 8 pages |
Members Slides file size 0.5MB 24 slides on 12 pages See the first page free |
Premium Member Slides + Speaker Notes  file size 0.7MB 24 slides on 24 pages See the first page free |
|
|
There are many different ways to select the stocks in which to invest (or to trade). So how to decide which approach to use? It seems as though many people use a Trend Trading strategy, without even realising it. So this presentation explains some of the finer things to be aware of when Trend Trading so that anyone without a concrete strategy can study the details and understand what is involved. [NOTE: We do NOT recommend trading in the markets without first consulting a suitably qualified and trustworthy professional.] In this presentation we:
[ref-2018-05]
|
Free Handout file size 2.2 MB 24 pages |
Members Slides file size 3.3 MB 68 slides on 34 pages See the first page free |
Premium Member Slides + Speaker Notes  file size 5MB 70 slides on 70 pages See the first page free |
|
|
Wouldn’t it be good if we could take a list of stocks (ie. your "stocks universe"), and sort the list with the strongest performing stocks (ie. the most bullish) at top of the list? And then invest in these stocks in anticipation of the best price performance? In this presentation we:
[ref-2018-01]
|
Free Handout file size 2.7 MB 28 pages |
Members Slides file size 7 MB 84 slides on 42 pages See the first page free |
Premium Member Slides + Speaker Notes  file size 7MB 86 slides on 86 pages See the first page free |
|
2017 |
||||
|
NOTE: This presentation was updated and delivered to the Melbourne ATAA meeting in January 2018 - see the next item above for the latest version. Wouldn’t it be good if we could take a list of stocks (ie. your "stocks universe"), and sort the list with the strongest performing stocks (ie. the most bullish) at top of the list? And then invest in these stocks in anticipation of the best price performance? This presentation was presented to the BullCharts User Group (both the Melbourne meeting and the online webinar), as well as the U3A Manningham group (Financial Health in Retirement). It has also been presented to the Canberra Chapter of the ATAA. [ref-2017-11]
|
Free Handout file size 2.6 MB 27 pages |
Members Slides file size 7 MB 68 slides on 41 pages See the first page free |
Premium Member Slides + Speaker Notes  file size 7MB 83 slides on 83 pages See the first page free |
|
|
Long-term buy-and-hold investing was quite acceptable and rewarding until the GFC hit in 2008, in which many investors lost a lot of money after following profressional advice. Even today there are dangers in following a buy-and-hold approach. In this presentation we share a number of examples of high profile stocks, and blue chip stocks, which have suffered from significant share price falls. And we show some of the ways to help guard against these risks. [ref-2017-02]
|
Free Handout file size 1.5 MB 23 pages |
Members Slides file size 3.5MB 68 slides on 34 pages See the first page free |
Premium Member Slides + Speaker Notes  file size 4MB 68 slides on 68 pages See the first page free |
|
2016 |
||||
|
TradeSim is a software tool that is available as a plug-in for the BullCharts charting software system (and for MetaStock). This presentation was prepared for the Australian BullCharts User Group meeting in October 2016. It walks through a case study example of using TradeSim to test a Moving Average Cross-Over strategy (with no guarantees of success). [ref-2016-10-2]
|
Free Handout file size 200 kB 11 pages |
Members Slides file size 1MB 31 slides on 16 pages See the first page free |
Premium Member Slides + Speaker Notes  file size 0.7MB 31 slides on 31 pages See the first page free |
|
|
This presentation slide set now replaced by the updated version in June 2018 above. [ref-2016-10-1]
|
Free Handout file size 200 kB 8 pages |
Members Slides file size 0.5MB 24 slides on 12 pages See the first page free |
Premium Member Slides + Speaker Notes  file size 0.7MB 24 slides on 24 pages See the first page free |
|
|
This presentation was delivered to the Manningham U3A (the Thursday "Financial Health in Retirement" group formerly known as the Stockmarket group) on Thursday 16 June 2016. The objectives behind this presentation and set of slides is to help regular investors understand the following:
[ref-2016-06]
|
Free Handout file size 1.5 MB 22 pages |
Members Slides file size 2.8MB 65 slides on 33 pages See the first page free |
Premium Member Slides + Speaker Notes  file size 3.6MB 65 slides on 65 pages See the first page free |
|
|
This set of slides was used in the May 2016 BullCharts User Group to lead through a discussion of technical analysis chart patterns. The session (and updated slides) covered the following topics:
[ref-2016-05]
|
Free Handout file size 0.6MB 9 pages |
Members Slides file size 1.5MB 26 slides on 13 pages See the first page free |
Premium Member Slides + Speaker Notes  file size 1.5MB 29 slides on 29 pages See the first page free |
|
|
This set of slides has been used to lead and facilitate a hands-on workshop discussion, utilising the Trading Worksheet handout document. The session covers the following topics:
The "Slides + Speaker Notes" version (for Premium Toolbox members) can be used as a self-study by individuals. [ref-2016-01, 2016-04]
|
Free Handout file size 0.6MB 20 pages |
Members Slides file size 1.6MB 60 slides on 30 pages See the first page free |
Premium Member Slides + Speaker Notes  file size 1.2MB 60 slides on 60 pages See the first page free |
|
2015 |
||||
|
This presentation has been supplanted by a couple of updated versions. The latest one in July 2022 - see that version here above. [ref-2015-11]
|
Free
Handout |
Members
Slides |
Premium
Member Slides + Speaker Notes |
|
|
Given the current investing
climate (since the GFC), it seems necessary to revise the
conventional investing approach and methods. This presentation
identifies some of the shortfalls of the traditional investing
methods, and discusses the Nimble
Short Term Investing approach. Also see the supporting web page.
[ref-2015-08]
|
Free
Handout file size 1.7MB 23 pages |
Members
Slides file size 2.2MB 68 slides on 34 pages See the first page free |
Premium
Member Slides + Speaker Notes  file size 3.5MB 65 slides on 65 pages See the first page free |
|
|
This slide set presentation is a workshop, and a revision of the session from 2012. It was presented to the ATAA Melbourne chapter at their July 2015 meeting. It uses the Trading Worksheet handout document. This set of slides can be used to lead and facilitate a workshop discussion. The "Slides + Speaker Notes" version (for Premium Toolbox members) can be used as a self-study by individuals, covering the following topics:
[ref-2015-07]
|
Free Handout file size 1MB 25 pages |
Members Slides file size 2.4MB 74 slides on 37 pages See the first page free |
Premium Member Slides + Speaker Notes  file size 1.6MB 74 slides on 74 pages See the first page free |
|
|
This is an updated version of the similarly named presentation delivered in November 2014 to a small private traders' group. It was delivered to the Melbourne AIA (Australian Investors Association) on 10 February 2015. Given the current investing climate (since the GFC), it seems necessary to revise the conventional investing approach and methods. This presentation identifies some of the shortfalls of the traditional investing methods, and discusses the Nimble Short Term Investing approach. Also see the supporting web page. This approach refers to a particular investing style that is applicable to investing in the equity market (the share market), and which adopts specific and clear views and interpretations. Some of it's underlying principles clearly challenge the conventional wisdom. The material in this presentation is presented under the following headings:
[ref-2015-02]
|
Free
Handout file size 1.7MB 26 pages |
Members
Slides file size 3.4MB 79 slides on 39 pages See the first page free |
Premium
Member Slides + Speaker Notes  file size 4MB 79 slides on 79 pages See the first page free |
|
2014 |
||||
|
*** Please note: A newer updated version of this presentation was delivered in October 2020 and is available above. When looking for stocks in which to invest, we might study the price chart and want to record our analysis and observations, and then re-visit the notes at a later time. But, what sort of observations are we talking about? and what are the options for recording them? This presentation describes a couple of analysis situations, with examples, and demonstrates a couple of ways to do this in the BullCharts charting software (including the use of the IntelliCharts feature). There is also a 20 minute video recording of this presentation that better shows the demonstration. [ref-2014-11-2]
|
Free
Handout file size 1MB 11 pages |
Members
Slides file size 1.4MB 32 slides on 16 pages See the first page free |
Premium
Member Slides + Speaker Notes (available soon) |
|
|
When it comes to investing strategies, there are literally thousands of possibilities, and many of them are “right”. This presentation describes just one possible approach - the Nimble Short Term Investing approach. Also see the supporting web page. The term “Nimble Short Term Investing” refers to a particular investing style that is applicable to investing in the equity market (the share market). This investing approach adopts specific views and interpretations. Some of it's underlying principles challenge conventional wisdom. The material in this presentation is presented under the following headings:
[ref-2014-11]
|
Free
Handout file size 1MB 9 pages |
Members
Slides file size 0.5MB 28 slides on 14 pages See the first page free |
Premium
Member Slides + Speaker Notes Now obsolete - see the more recent presentation above (Feb 2015). |
|
|
This presentation has been supplanted by a couple of updated versions. The latest one in July 2022 - see that version here above. [ref-2014-10]
|
Free
Handout |
Members
Slides |
Premium
Member Slides + Speaker Notes |
|
|
This short presentation to the Templestowe Valley Probus group was delivered as a hands-on, participative case study-come-quiz, with lots of interaction and discussion. (It was delivered along with the "Investing Tips" presentation below.) It was also delivered to the Manningham U3A Stockmarket group on 16 October 2014 (with some minor updates to some words on some slides). These slides show a sample price chart and ask the question: "What would you do here? Would you buy this stock?". In real life the actual situation might have been your stock broker telling you that the shares are cheap, and they should be snapped up (but the broker won't tell you that the shares could get even cheaper). Test out your own investing judgement, and study the price charts in these slides. See if you would be profitable, or loss-making. [ref-2014-09-1]
|
Free Handout file size 600kB 9 pages |
Members Slides file size 2MB 25 slides on 13 pages See the first page free |
Premium
Member Slides + Speaker Notes  file size 1.8MB 30 slides on 30 pages See the first page free |
|
|
This presentation to the Templestowe Valley Probus group was an interactive discussion, based on an earlier version of the presentation to the U3A group in 2013. This presentation focuses on two specific topics: There are several related topics that couldn't be included in this presentation due to the time needed to cover the topic. See a list of them on the Toolbox Share Market page. For more information on Success Secrets, refer to the earlier presentation below Sharemarket 101 - Avoiding the pitfalls....Note that the original "Members Slides" posted here have been updated - see the small revision numbering the bottom right corner of the first slide - the latest version is "Revision 2b". [ref-2014-09-2]
|
Free Handout file size 1.4MB 21 pages |
Members Slides file size 1.5MB 54 slides on 27 pages "Revision 2b" See the first page free |
Premium
Member Slides + Speaker Notes  file size 2.8MB 54 slides on 54 pages See the first page free |
|
|
Technical Analysis - A lot of people talk about it; but what does it really mean? What is "technical analysis"? And how can I make money from it? This set of slides is in use by the ATAA at various expos, and meetings, as an introduction to the subject of Technical Analysis for newbies. It provides a quick overview of all the topics that comprise the bigger subject of technical analysis, and is a cut down version of Robert's 6-hour seminar. For more information about technical analysis, see thespecial Toolbox web page. [ref-2014-08-1]
|
Free
Handout file size 1MB 22 pages |
Members
Slides file size 3.5MB 64 slides on 32 pages See the first page free |
Premium
Member Slides + Speaker Notes  file size 2.7MB 64 slides on 64 pages See the first page free |
|
|
We have a list of stocks in which we could invest. But we can't invest in all of them at this time (eg. not enough funds). So, how to choose which one(s)? How can we “rank” them? Perhaps in order of performance, so that we are buying into the better performing stocks. This presentation explains the dilemma, shows some price charts of performing stocks, and explores the possibility of using both a Moving Average indicator to quantify stock performance, and the ROAR indicator. The next updated version will also explore how to easily identify strong sectors. This was presented to the June BullCharts User Group meeting, and the 19th June U3A Stockmarket Group meeting. It will be updated with more detail, and presented to the July ATAA meeting in Melbourne after which these slides will be updated, and the Premium Member version (slides + speaker notes) will be published here. [ref-2014-04]
|
Free
Handout file size 1MB 17 pages |
Members
Slides file size 2.3MB 50 slides on 25 pages See the first page free |
Premium
Member Slides + Speaker Notes  file size 3.5MB 64 slides on 64 pages See the first page free |
|
|
This presentation has now been supplanted by a slightly tweaked version in June 2022 - see the newer version here. [ref-2014-03-02]
|
Free
Handout |
Members
Slides |
Premium
Member Slides + Speaker Notes |
|
|
I was invited to present to a small group of private traders in South Yarra, so I put together some key points together related to the typical trader's journey - the progression of learning through various stages:
[ref-2014-03-01]
|
Free
Handout file size 1.2MB 20 pages |
Members
Slides file size 2.6MB 60 slides on 30 pages See the first page free |
Premium
Member Slides + Speaker Notes  file size 2.8MB 60 slides on 60 pages See the first page free |
|
|
At about this time every year, a number of commentators, economists and analysts come out with their share market forecast for the year ahead. This presentation contains this technical analyst's view of the year ahead - well, in fact, not for the year ahead but for the month's ahead. And beware of the share market bears. See the presentation slides at right for all the details. [ref-2014-01-mo]
|
Free
Handout file size 1.3MB 20 pages |
Members
Slides file size 3.5MB 58 slides on 29 pages See the first page free |
Premium
Member Slides + Speaker Notes  file size 3.5MB 60 slides on 60 pages See the first page free |
|
|
Every year around Christmas time there is a lot of discussion about the so-called Santa Rally; but is it really true or is it mere fantasy? This short presentation explores this question, and explains two accepted definitions for the term, along with the performance of the Australian market in the last few years. Another question worth pondering is: "is the Santa Rally at all helpful for regular investors?" See the presentation slides for the answer. Also see the Santa Rally web page. [ref-2014-01-sr]
|
Free
Handout file size 0.5MB 7 pages |
Members
Slides file size 1MB 20 slides on 10 pages See the first page free |
Premium
Member Slides + Speaker Notes  file size 1MB 20 slides on 20 pages See the first page free |
|
2013 |
||||
|
This presentation has been supplanted by a couple of updated versions. The latest one in July 2022 - see that version here above. [ref-2013-11]
|
Free
Handout |
Members
Slides |
Premium
Member Slides + Speaker Notes |
|
|
This presentation focuses on
studying the performance of the Australian market (the All
Ordinaries index - XAO) using contemporary technical analysis
tools, and Robert's "4-Windows" analysis approach. Topics
covered include the following (some of which are the application
of Technical Analysis to current charts):
[ref-2013-10]
|
Free
Handout file size 1.9MB 29 pages |
Members
Slides file size 5.4MB 85 slides on 43 pages See the first page free |
Premium
Member Slides + Speaker Notes (pending) file size: 80 slides |
|
|
In a falling market (eg. a bear), should we keep stocks for the dividends? or sell? (to avoid the impacts of a bear market!) REVISED - 30 August 2013 This presentation is a revision
and update of an earlier presentation that discussed the impacts
of a bear market. The GFC that started in early 2008 is now a
few years behind us. So it is useful to update the earlier
figures that address the question:- "Should
I hold my stocks for the dividends? or strategically sell?" Key
topics include:
[ref-2013-08]
|
Free
Handout file size 1.8MB 30 pages |
Members
Slides file size 3.6MB 88 slides on 44 pages See the first page free |
Premium
Member Slides + Speaker Notes (pending) file size: 80 slides |
|
|
A current analysis of the
Australian share market studying the All Ordinaries (XAO) index,
and utilising the “4
Windows” analysis approach. The analysis includes the use
of:
[ref-2013-07-4w]
|
Free
Handout file size 1.6MB 25 pages |
Members
Slides file size 7MB 75 slides on 38 pages See the first page free |
Premium
Member Slides + Speaker Notes  file size 4.3MB 75 slides on 75 pages See the first page free |
|
|
This presentation is a major
update to the one from July 2011 (see below),
and presented to the Newcastle ATAA chapter on 13 July 2013. The
key features:
See the answers in the slides (with discussion in the Premium Member Speaker Notes). [ref-2013-07a]
|
Free
Handout file size 2MB 30 pages |
Members
Slides file size 3.4MB 90 slides on 45 pages See the first page free |
Premium
Member Slides + Speaker Notes  file size 4.7MB 90 slides on 90 pages See the first page free |
|
|
This presentation is a major
update to the one from July 2011 (see below),
and presented to the Newcastle ATAA chapter on 13 July
2013. The key features:
[ref-2013-07b]
|
Free Handout file size 1.6MB 24 pages |
Members Slides file size 2½MB 70 slides on 35 pages See the first page free |
Premium Member Slides + Speaker Notes  file size 4MB 70 slides on 70 pages See the first page free |
|
|
This presentation has been
supplanted by an updated version in July 2022. See
the newer presentation here above.
Presented to the Newcastle ATAA
Chapter in July 2013, after earlier delivery to the BullCharts
User Group June 2013) and Manningham U3A Stockmarket group in
November 2012.
[ref-2013-07c] [ref-2012-08-r4]
|
Free Handout |
Members Slides |
Premium Member Slides + Speaker Notes |
|
|
Please note:- This presentation
has been updated with a more recent version of the same name listed above.
This presentation to the U3A
Manningham (Stockmarket group) in May 2013 was an interactive
discussion on two related topics, with reference to two recently
new web pages:
[ref-2013-05]
|
Free Handout file size 1MB 16 pages |
Members Slides file size 1.2MB 48 slides on 24 pages |
Premium Member Slides + Speaker Notes  file size 2.5MB 47 slides on 47 pages |
|
|
A 1-hour free presentation at
the Box Hill (Whitehorse Manningham) Library 26 February 2013.
This session was video recorded (courtesy of Gavin Ash)
- see the
video in YouTube. There was also a 2-page handout document.
Note:
The Slides download at right (for Toolbox Members) includes many
more slides (price charts) than were delivered within the one
hour presentation.
The topics covered include:
 See the promo flyer here... [ref-2013-02]
|
Free Handout file size 1.2MB 20 pages |
Members Slides file size 3.8MB 92 slides on 46 pages See the first page free NOTE: This version includes many more slides than were delivered in the presentation. |
Premium Member Slides + Speaker Notes  file size 4.3MB 94 slides on 94 pages See the first page free |
|
|
A current analysis of the
Australian share market studying the All Ordinaries (XAO) index,
and utilising the “4
Windows” analysis approach.
Presented to the Melbourne ATAA chapter January 2013 meeting. [ref-2013-01]
|
Free Handout file size 1MB 16 pages |
Members Slides file size .21MB 46 slides on 23 pages |
Premium Member Slides + Speaker Notes  file size 2.8MB 49 slides on 49 pages |
|
2012 |
||||
|
Presented to the Manningham U3A Stockmarket group in November 2012, this is an overview and introduction to this difficult topic relating to the psychology and emotions of investing, and introducing some strategies to overcome them. Introducing the following topics:
[ref-2012-08]
|
Free Handout file size 1.5MB 23 pages |
Members Slides file size 1MB 68 slides on 34 pages |
Premium Member Slides + Speaker Notes  file size 3MB 68 slides on 68 pages |
|
|
This slide set presentation is a workshop, and is a further update and overhaul of the earlier versions below using the Trading Worksheet handout document. This set of slides can be used to lead and facilitate a workshop discussion. The "Slides + Speaker Notes" version (for Premium Toolbox members) can be used as a self-study by individuals, covering the following topics:
[ref-2012-07]
|
Free Handout file size 1.5MB 22 pages |
Members Slides file size 4.6MB 64 slides on 32 pages |
Premium Member Slides + Speaker Notes  file size 2.8MB 64 slides on 64 pages |
|
|
Robert prepared some material for publication in
the June 2012 monthly edition of the ASX Investor
Update newsletter (even if the
resulting article headline was a little misleading). The article is a Technical Analysis review of four key "Mum and Dad" stocks - Commonwealth Bank (CBA), Woolworths (WOW), Telstra (TLS) and Qantas (QAN). And the article is a realistic case study discussion that demonstrates the key topics: trends, Stop Loss, support and resistance, the semi-log chart, and the 30-week SMA (as per Weinstein). As usual, the "Slides+Speaker Notes" (for Premium Members) at right include extra notes to help with understanding the short-hand comments on the slides themselves. [ref-2012-06]
|
Free Handout file size 0.7MB 11 pages |
Members Slides file size 1.8MB 32 slides on 16 pages |
Premium Member Slides + Speaker Notes  file size 1.6MB 32 slides on 32 pages |
|
|
This slide set presentation is a workshop, and is an updated version of a similar one from late 2010. This one was presented to the BullCharts User Group in May 2012, with the Trading Worksheet handout document. This workshop will be revised and presented at the Melbourne ATAA meeting in July 2012. [ref-2012-03]
|
Free Handout file size 0.5MB 9 pages |
Members Slides file size 2MB 54 slides on 27 pages |
Premium Member Slides + Speaker Notes (pending) |
|
|
This presentation is an updated and totally revised and refreshed version of earlier material on this topic. It was presented to the Manningham U3A Stockmarket group on Thursday 10 May 2012. This updated material is quite lengthy (you can tell from the page counts shown at right), and it really needs a session of about 2 hours to present properly, and I tried to squeeze it into only an hour and a quarter (a bit tight). The Handout download and Slides docs are now available at right, and the Speaker Notes will be available soon. See more information on this topic on the web here (currently being updated), and the earlier "Beware the Bears..." presentation material below. The ten key lessons from the GFC are then espoused in some detail. This includes some sample cycles (eg. investment clock, decennial cycle, and property and Presidential cycles). [ref-2012-02]
|
Free Handout file size 3MB 47 pages |
Members Slides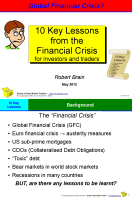 file size 5MB 146 slides on 73 pages |
Premium Member Slides + Speaker Notes (pending) |
|
|
This is an updated and expanded version of the earlier presentation below. This version includes more detail about the low market cap companies, and the high risk (high debt) stocks. It also includes the newer screen shots from the CommSec web site showing how to search for stocks that meet specific fundamental analysis criteria (eg. high ROE, low Debt/Equity, and low PEG ratio). [ref-2012-04]
|
Free Handout file size 1.3MB 31 pages |
Members Slides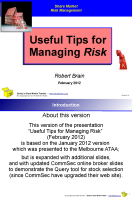 file size 1.7MB 92 slides on 46 pages |
Premium Member Slides + Speaker Notes  file size 2.5MB 93 slides on 93 pages |
|
|
Take an unfair advantage with a check list of 30 ways to increase your success in the markets. Risk and money management is not discussed much, because many people see it as too hard and too complex; but in this session, Robert lists a number of simple ways that you can increase your chances of success, and studies four of these in detail. This includes consideration of two key Fundamental Analysis criteria as well as very useful Technical Analysis considerations. [ref-2012-01]
|
Free Handout Replaced by the updated February version above. |
Members Slides Replaced by the updated February version above. |
Premium Member Slides + Speaker Notes Replaced by the updated February version above. |
|
2011 |
||||
|
How to preserve capital and minimise losses (or How to sleep at night - with maximum profits) September 2011 This presentation has now been supplanted by a newer, tweaked version in June 2022 - see the new version here. [ref-2011-09]
|
Free Handout |
Members Slides |
Premium Member Slides + Speaker Notes |
|
|
NOTE: This presentation is updated July 2013 above. This presentation is now the latest version with updated charts of the first half (ie. Part 1) of the earlier "Anti-decimation..." presentation. The key features in this version are:
See the answers in the slides (with discussion in the Premium Member Speaker Notes). [ref-2011-07a]
|
Free Handout file size 1MB 23 pages |
Members Slides file size 1MB 68 slides on 34 pages |
Premium Member Slides + Speaker Notes  file size 2MB 68 slides on 68 pages |
|
|
NOTE: This presentation is updated July 2013 above. This presentation is the latest version with updated charts of the second half (ie. Part 2) of the earlier "Anti-decimation..." presentation. The key features in this version are:
[ref-2011-07b]
|
Free Handout file size 1MB 23 pages |
Members Slides file size 2½MB 68 slides on 34 pages |
Premium Member Slides + Speaker Notes  file size 2½MB 68 slides on 68 pages |
|
|
This presentation to the U3A (Manningham) Sharemarket Group (March 2011) was a recap of three topics, plus an introduction to the new material regarding Contrarian Investing Redefined. A discussion about Candlesticks, Volume and Stop Loss. Also an introduction to: Contrarian Investing Redefined. |
Free Handout file size 1½ MB 8 pages |
Members Slides file size 3MB 46 slides on 23 pages |
Premium Member Slides + Speaker Notes  file size 2MB 47 slides on 47 pages |
|
|
The handout and slides available at right were delivered to the Melbourne ATAA meeting (April 2011), and again to the Perth ATAA (May 2011). They are an updated version of the set delivered to Manningham U3A Sharemarket Group (March 2011). It can take many years of reading text books and newspapers, attending lectures and seminars, and watching news reports, to hear a number of those very useful “tips” and observations about the share market. We can call them Share Market GEMs, or pearls of wisdom. They might be very useful clichés, adages, proverbs, axioms or infamous Wall Street sayings. BUT, watch out for the furphies! Over many years, Robert has accumulated a long list of more than 90 of these Share Market GEMs, many of which are great snippets of very useful information. But be careful, because some of the touted Wall Street sayings are actually furphies! In this presentation Robert shares many of the more useful, and the more contentious, GEMs. “A rising tide lifts all boats” — or does it? “It's time in the market that is more important, because we can't time the market” — the market professionals who tout this one obviously know nothing about technical analysis. “Sell in May and go away”. Show me a list of Blue chip shares — are they really “blue chip”? Public floats — a great way to make money (not!). In Australia, a correction or bear market happens on average every 2.9 years, and the market takes an average of 3.2 years to recover to new highs. And did you know that the share market is like an elephant? [ref-2011-03/gems]
|
Free Handout file size 1.4MB 28 pages |
Members Slides file size 3MB 84 slides on 42 pages |
Premium Member Slides + Speaker Notes  file size 2MB 85 slides on 85 pages |
|
|
This presentation to the U3A (Manningham) Sharemarket Group (March 2011) was a preview of the GEMs presentation that is being prepared for delivery to the Melbourne ATAA (April 2011), AND a section on "How to Pick Winners in today's market" - using Robert's Weekly Watch List table as a case study example of how to spot the winners. |
Free Handout file size ¼ MB 6 pages |
Members Slides file size ½ MB 16 slides on 8 pages |
Premium Member Slides + Speaker Notes  file size ½ MB 16 slides on 16 pages |
|
|
Note: This presentation is now superseded
[posted 16 January 2011 and revised 10 March 2011]by two separate presentations above. This presentation is the absolute latest, updated, and modified version of the earlier "Anti-decimation..." presentations. This slide set supplants the set from both the Melbourne and Canberra ATAA presentations in late 2010. It was presented to the ATAA Sydney Chapter January 2011, and it was used as the basis of an interactive presentation to the Share Market Investment Club (East Doncaster Uniting Church) in March 2011. Also delivered to the Perth ATAA May 2011. It was originally delivered in a slightly different form to the Melbourne PC User Group WASINT in October 2010. [ref-2011-01/fta02]
|
Free Handout file size 2.3MB 41 pages |
Members Slides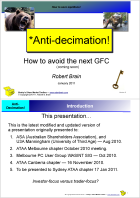 file size 4.4MB 120 slides on 60 pages |
Premium Member Slides + Speaker Notes 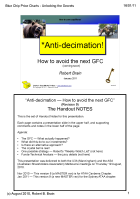 file size 4.5MB 121 slides on 121 pages |
|
|
[posted January 2011] This is the set of slides that was used at the December Melbourne BullCharts User Group meeting to explain the Trading Work Sheet. |
Free Handout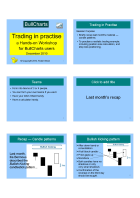 file size <1MB |
Members Slides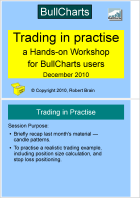 file size <1MB 26 slides on 13 pages |
||
2010 |
||||
|
[posted 15 October 2010] This presentation is yet another updated/modified version of the "Blue Chip Price Charts - Unlocking the Secrets" presentation listed below. It was delivered to Melbourne PC User Group WASINT on Tuesday 12 October 2010. The content will soon be merged into another one of the recent presentations to eliminate the extra numbers of slide sets. [ref-fta03]
|
Free Handout file size 1MB |
|||
|
This presentation was delivered Thursday 19 August 2010 to U3A (Manningham) and the ASA (Melbourne). [U3A - University of the Third Age; ASA - Australian Shareholders Association] The session agenda:
[ref-fta01]
|
Free Handout file size 1MB |
Members Slides file size 4.5MB 87 slides on 43 pages |
Premium Member Slides + Speaker Notes  file size 4MB 86 slides on 86 pages |
|
|
A presentation of 40 minutes duration which is a cut-down version of Robert's 4-hour Technical Analysis Introduction seminar (the seminar runs every second month and is now called "Blue Chip Price Chart Secrets"). These slides are a subset of the full collection of slides in the seminar. This presentation was delivered to the October 2009 meeting of the Melbourne ATAA. (This pdf file download is about 3.5MB). The 100+ page handbook from the seminar is also available - in the OnLine Shop, or for Premium Members to download for free (now included with Premium Toolbox membership). [ref-ta01]
|
Free Handout file size 1.5MB |
Members Slides file size 4MB 92 slides on 46 pages |
(pending) | |
|
A presentation to the Australian BullCharts User Group (26 May 2010), explaining and demonstrating: Trade Entry, Initial Stop Loss, Risk Amount, Target Price, Risk versus Reward, Reward to Risk Ratio, Trailing Stop. |
Free Handout file size 0.5MB |
Members Slides file less than 2MB 30 slides on 15 pages |
Premium Member Slides + Speaker Notes  less than 1MB 30 slides on 30 pages |
|
|
A presentation to the Manningham U3A group (17 June 2010), explaining and demonstrating: Funda-Technical Analysis, the use of technical chart indicators as a high-level market filter, as well as for stock selection for entry, and to specify stock exit strategy. The Slides+SpeakerNotes Premium Members' version will be available soon. |
Free Handout file size 0.5MB |
Members Slides file size 0.5MB |
Premium Member Slides + Speaker Notes  (download available soon) |
|
|
This presentation for the U3A group in Manningham (February 2010) looks at how bad the bear markets can really be, and how to use the Weinstein 30-week SMA, and the Twiggs Money Flow indicator to look out for a bear market. It uses a key part of Robert's weekly market analysis strategy for analysing the market. More information about bear markets is here. |
Free Handout file size 1MB |
Members Slides file size 4MB 53 slides on 27 pages |
(pending) |
|
| Aussie Bear and Bull Markets Analysis
(Revision 9) This presentation (January 2010) initially takes a quick look at the newspaper headlines that often seem to contradict each other "market is up 10%...", when it is actually "down 5%...". And it explains that Weekly charts show us different numbers compared to Daily or Monthly charts. It describes the last 7 bear markets / corrections, and the amount of damage they did - including the amount of time taken to reach new highs. Then it looks at the last 8 bull markets, and the amount of increase. It finishes off by introducing the topic of chart indicators to help identify turning points in the market. This presentation has developed from the Beware the Bears one below. And it was used to start the Weekly Share Market Analysis that Robert now does on a weekly basis as a part of his own trading strategy. He can share his weekly analysis thoughts with you by email - simply register your interest. [ref-bbm02]
|
Free Handout file size 1MB |
Members Slides file size 4MB 76 slides on 38 pages |
(pending) | |
2009 |
||||
|
This presentation was originally entitled "The 10 Key Lessons from the GFC (for Traders and Investors)". It has been renamed and massively updated. It provides some background into the GFC of 2008-9, then reminds us that "trends" are important. The ten key lessons from the GFC are then espoused in some detail. This includes some sample cycles (eg. investment clock, decennial cycle, and property and Presidential cycles). The presentation goes on to provide some technical chart features and indicators that can be used to help identify turning points in the market so that we can be on the lookout for the share market bears. This presentation has been delivered to: the Manningham U3A, the Melb PC User Group WASINT Special Interest Group and the EIS group (of Phil Anderson) in November 2009. For some free information on this topic, see Robert's "The 10 Key Lessons..." web page (the link just above). [ref-bbm03]
|
Free Handout file size 1MB |
Members Slides file size 4MB 136 slides on 68 pages |
(pending) | |
|
This session was initially conceived in late 2008 to help answer investors' questions about what actually happened in the infamous GFC, with the bear market crash of 2008. It provides some background into the GFC, then reminds us that "trends" are important. The ten key lessons from the GFC are then espoused in some detail. This includes some sample cycles (eg. investment clock, decennial cycle, and property and Presidential cycles). An updated version of this presentation was produced and entitled "Beware the Share Market Bears..." (see above). [ref-10key]
|
Free Handout file size 0.5MB 28 pages |
Members Slides file size 2MB 82 slides on 41 pages |
(not available) |
|
|
A presentation to the Australian BullCharts User Group in Melbourne in October 2009. This describes 7 different ways to set a Stop Loss. Of course, the notion of a Stop Loss is to help minimise losses on an investment if the price moves unfavourably. And it is to help protect profits if/as the price action moves favourably. The information in the presentation applies to both the Initial Stop, and to Trailing Stops. This is explained in the first few slides. The presentation goes on to describe a number of different ways to determine a stop loss level. [ref-stops02]
|
Free Handout file size 1MB |
Members Slides file size 2MB 28 slides on 15 pages |
(pending) | |
2007 - 2008 |
||||
|
A presentation delivered to the Melbourne BullCharts User Group in January 2008. This presentation introduces the concept of Author Strategies in the BullCharts charting software, and in particular Stan Weinstein's concepts as explained in his best selling book "Secrets for Profiting in Bull and Bear Markets". These concepts include Stan Weinstein's Stage Analysis, and using a BullCharts Scan to search for stocks in a specific Market Stage. |
Free Handout file size 0.2MB |
Members Slides file size 0.3MB 21 slides on 11 page |
(pending) | |
|
A presentation delivered to the July 2008 meeting of the Melbourne ATAA. This presentation starts off with some details about Trading Plans, which every trader should have. Then it covers the topics of trade entry, stops, and periodically revising stops. One question for traders is the issue of how to monitor an open trade, and review the progress and raise trailing stops. All these aspects are covered with reference to a realistic Trading Strategy example and uses a Watchlist, a Market Scan, and setting the price target. [ref-strategy01]
|
Free Handout (file size 0.5MB) |
Members Slides file size 2MB 45 slides on 23 pages |
(pending) | |
|
A simple presentation to introduce the MACD technical indicator, and the MACD Histogram, first delivered to the BullCharts User Group in February 2007, and repeated with updates in April 2011. MACD - what is it? and how is it derived? This is covered in the first few slides, including the calculation for the Fast line and the Slow Signal line. It goes on to cover the MACD Histogram, and additional observations. Also see in the eBook Articles (especially TA-4230). |
Free Handout file size 0.5MB 6 pages |
Members Slides file size 2MB 18 slides on 9 pages |
Premium Member Slides + Speaker Notes  file size 1MB 18 slides on 18 pages |
|
|
A simple presentation to introduce the concept of Stop Loss, and how to implement it, delivered to the BullCharts User Group in March 2007. The presentation also considers some of the possible triggers for people to make share purchases, and some triggers for selling. Knowing this can help us to set a better stop loss position. Three stop loss approaches are covered - the P-SAR (Parabolic SAR) indicator, ATR and the Wilson ATR Trailing Stop, and Daryl Guppy's Count Back Line (CBL). More details on these topics in the eBook Articles. |
Free Handout (file size 0.2MB) |
Members Slides file size 0.3MB 23 slides on 12 pages |
Premium Member Slides + Speaker Notes  less than 1MB 22 slides on 22 pages |
|
| Back to Top.. |
* MA - Members' Area - for Toolbox Members only.
* Premium handouts are for Toolbox Premium Members.
© Copyright 2006-2025, R.B.Brain - Consulting (ABN:
52 791 744 975)
Last revised: 12 September 2025