Overview - The "4 Windows" analysis method
For those people starting out at trying to
understand the markets and
price charts, and for those more experienced investors and traders, it
is useful to have some sort of "structure" or "framework" around the
body of
knowledge on this topic for a couple of reasons. Firstly, it is useful
to have a broad overview of the key areas of technical
analysis to give
us the complete picture, and to help make sure we don't ignore
something that might be useful. Secondly, we can use this is a
checklist to help us remember the key areas that we have individually
chosen to utilise.
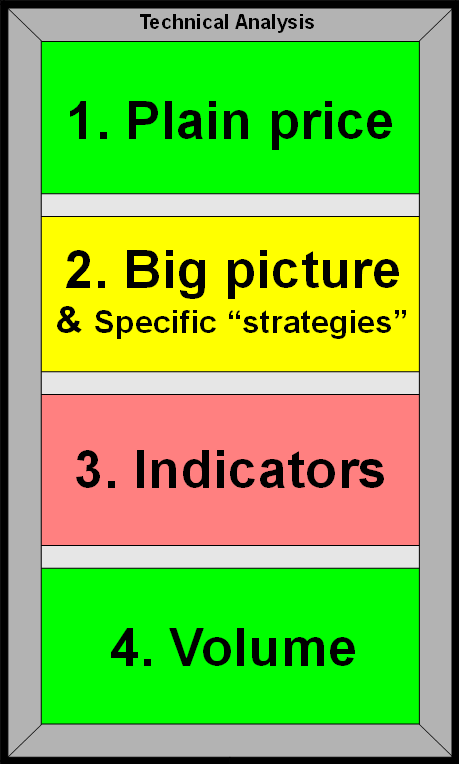
The "4 Windows" analysis approach utilises four
different
ways
to "view" the price chart of an index (or a stock) and so literally
gives us four "windows of perspective" about the performance of the
index
(or a stock). The diagram at right illustrates the high-level
overview of
this approach.
But note
that we are not advocating that
you over-complicate your analysis by doing everything that is described
here. All we are doing is offering some analysis
suggestions for consideration.
Window 1 - Plain price - Trends,
Support, Resistance, and Chart Patterns
The uppermost window is to remind us that it is useful to
eye-ball the
plain price chart, and gain a quick feel for the presence (or absence)
of any
price
trend, any levels of support and resistance, and any chart
patterns.
Many successful traders and investors utilise only the concepts
depicted in this window, and they ignore the other three windows.
Window 2 - Big Picture &
perhaps your favourite "strategy"
The second window is to help fill out an
understanding of the "big picture". This can be done in a number of
ways, and may include your own preferred specific approach or favourite
strategy
(such as cycle analysis, Elliott Wave, or Gann). And it is most
important to zoom the chart out and view the longer time frames -
because the market is like an elephant.
Window 3 - Chart indicators
This window is to remind us that the subject of technical analysis
includes a range of chart indicators. Some people don't use
any
indicators because they
believe the plain price chart tells them everything. But many people
believe they can be very useful.
Window 4 - Volume
The bottom window is to remind us
that the consideration of volume can be important.
It
is important to point out that much of the field of technical analysis
applies to the study of most financial instruments. The material here
is written with share market equities in mind; but mostly also applies
to other instruments (such as foreign currencies, commodities, etc.).
More details
For more information on this topic, see the
detailed page...
|