Overview - The "4 Windows" analysis method
Remember that the four windows that form the
basis
of this approach are:
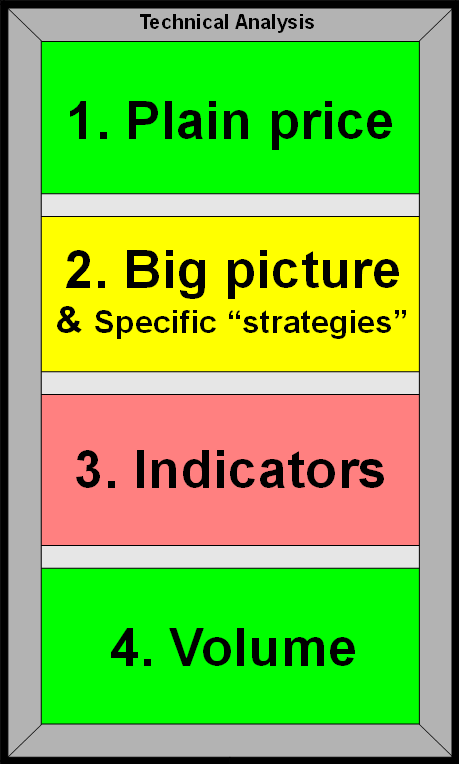
Window 1 - Plain price - Trends,
Support, Resistance, and Chart Patterns
The uppermost window is to remind us that it is useful to
eye-ball the
plain price chart, and gain a quick feel for the presence (or absence)
of any
price
trend, any levels of support and resistance, and any chart
patterns.
Many successful traders and investors utilise only the concepts
depicted in this window, and they ignore the other three windows.
Window 2 - Big Picture &
perhaps your favourite "strategy"
The second window is to help fill out an
understanding of the "big picture". This can be done in a number of
ways, and may include your own preferred specific approach or favourite
strategy
(such as cycle analysis, Elliott Wave, or Gann).
Window 3 - Chart indicators
This window is to remind us that the subject of technical analysis
includes a range of chart indicators. Some people don't use
any
indicators because they
believe the plain price chart tells them everything. But many people
believe they can be very useful.
Window 4 - Volume
The bottom window is to remind us
that the consideration of volume can be important.
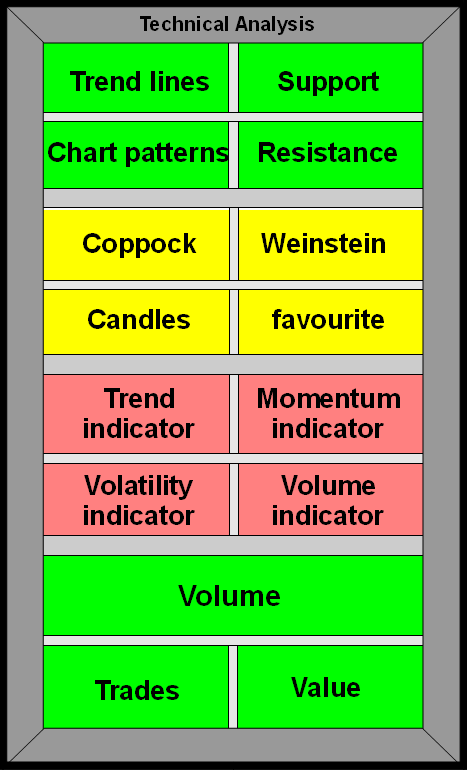
The upper three of the four windows can be
subdivided into four smaller windows, to remind us of the different
sub-topics
within each section. The detail is indicated diagrammatically
at right,
and explained in more detail below.
|
| 
The "4
Windows"
analysis approach
|
The
details
|
|
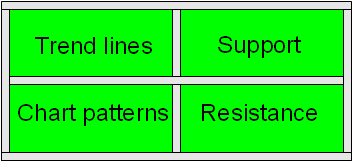
Window 1 - Plain price
The uppermost window actually contains
four sub-views, or four window panes.
This window and it's four window panes remind us
that it is useful
to eye-ball the price chart, and to look at the peaks and troughs in
price. If we can't immediately see the features, we can draw lines on
the chart to join together any successive
peaks, or successive troughs, and horizontal lines at the peaks and
troughs. Then any lines that don't make sense can be deleted. The end
result might be valid trend lines, levels of support and resistance,
and possibly a chart pattern (like a triangle, wedge, double top, etc.).
But what sort of chart should we use? - daily,
weekly, monthly?,
and a line chart or candles or bars?
The
first thing that is certain is to view at least two different time
frames, and possibly three (because the
market is like an elephant).
This might be to firstly view a monthly chart over several
years, then drill down to a shorter time period and view the weekly
chart,
and eventually view the daily chart. Remember that there might be an
uptrend in one time frame, and a downtrend in another time frame.
|
|
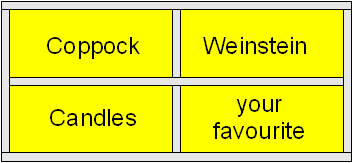
Window 2 - Big picture and your own
strategies
The second window is to point out two perhaps
different things.
Firstly, that sometimes there are specific tools or methods that can
help to understand the big picture. Secondly, that there are
some very specific approaches
(like Elliott Wave or Gann analysis) that some people find very useful
(for both big picture and shorter time frames). And it is most
important to zoom the chart out and view the longer time frames -
because the market is like an elephant.
The items
mentioned here are this commentator's own favourites:
- Coppock chart
indicator (on a monthly chart)
was designed to indicate turning points at market bottoms.
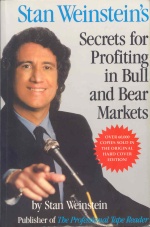 Weinstein
- In his well-regarded book "Secrets
for Profiting in Bull and Bear
Markets", Stan Weinstein describes his strategy of viewing
weekly price
charts, and a 30-week Moving Average, and to consider "Stage Analysis".
See more details here. Weinstein
- In his well-regarded book "Secrets
for Profiting in Bull and Bear
Markets", Stan Weinstein describes his strategy of viewing
weekly price
charts, and a 30-week Moving Average, and to consider "Stage Analysis".
See more details here.- Candlesticks
- The usefulness of studying candles, both individual candles and
multi-candle patterns, should not be overlooked.
See more details about candlesticks.
- Your favourite
- The fourth pane in this window is to remind us that we might find a
specific field of study useful, so we should keep our options open.
This includes the use of Elliott Wave analysis, as well as the studies
and ideas of Gann.
 And don't forget - the
market is like an elephant, so always look
at a longer time frame as well. The extra insight can be surprising. And don't forget - the
market is like an elephant, so always look
at a longer time frame as well. The extra insight can be surprising.
|
|
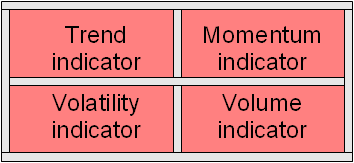
Window 3 - Chart indicators
The third window is all about technical
analysis chart indicators. This window also has four
window panes, to remind us that the
vast collection of chart indicators can be grouped
into four basic categories - trend indicators, momentum, volatility and
volume indicators. If we are keen to use one or more
indicators, then we
should consider an indicator from the separate groups - not all from
the one group.
Note that some people don't use any indicators
at all because they
believe the plain price chart tells them everything they need to know.
|
|
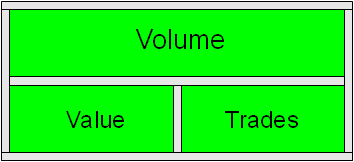
Window 4 - Volume
The bottom window is to remind us
that volume can be an important consideration, and that the volume pane
of the price chart ought
to be viewed.
Also,
this bottom window actually comprises three window panes, to remind us
that not only is the volume important, but for investors and traders it
is also very useful to understand the value traded per
day or week, and the number of trades
that takes place each day or week. These can help to make sure a
position size is not too large, and also to help make sure we invest in
stocks with enough liquidity to enable us to sell out quickly if
required.
|
|
|


