What does blue chip really
mean?
The ASX web site currently (post-GFC)
defines blue
chip as follows:
"Larger companies with a long
history of profitability and stability."
The ASX revises this definition from time to time (this
version is different to the one that was posted on the web in 2008).
But what does this really mean? Let's take a look at the definition in
detail.
"Larger companies..." -
Okay, so blue chip companies are larger.
But larger than what? We could look at the definitions for "large cap"
companies versus "medium cap" or "small cap" companies, but there is no
standard
definition for this. There isn't a list of "larger" companies. So this
is a very subjective description. If we prepared a list of all
companies, and sorted it by market cap, where would we draw the line to
distinguish large caps from medium caps?
"...long history..." -
The blue chip companies have a long history.
Well, how long is "long" - is it just a few years? or ten years? or
longer?
"...profitability..." -
So, how do we define profitability?
Is this the amount of profit after tax? Or perhaps profit before tax
(EBIT)? What
about the Return on Funds? ROE (return on equity)? or ROSF (return on
shareholder funds)? Or what? And to what degree are they profitable? If
we look at ROE, for instance, do we want to see a 10 percent Return on
Equity over just three years? or maybe over 5 years? or 10 years?
"...stability..." - How
on earth do we define stability?
So, we can see that this definition of blue chip is very
vague, and it doesn't really tell us anything substantive about a
company that is labelled as a blue
chip.
Does this really matter?
We are told that it is good to have blue chip
companies in our portfolios.
Lots of people talk about blue
chip companies.
Lots of investors have so-called blue chip companies in their
portfolios.
Our broker or financial advisor might recommend that we include blue
chip stocks in our investment portfolio. So, how do we find
out which stocks are blue chip?
Try this - Ask your broker or adviser for a list of blue chip stocks.
They probably won't
provide one - because there isn't one.
If they do give you one, ask them what qualifies a company to appear on
their list.
And if they do give you a list, it might be similar to a list from
another source, but it probably won't be identical.
 How did the term blue
chip come about? How did the term blue
chip come about?
Well,
many years ago, the blue coloured chip in the casino was the most
highly valued chip of all. And so this label was applied to companies
that were considered to be highly valued.
(BTW - These days the blue chip still is the most highly
valued in some casinos, but
not in all casinos.)
Blue chip stocks can be disappointing!
Would it surprise you to hear that blue chip
stocks can be disappointing?
Their share price performance is not guaranteed.
If you want to see capital improvement, there are times when you might
be waiting quite
awhile.
It
only takes a common old bear market, or a severe market correction, to
highlight how poorly many blue chip stocks perform over the medium
term. If you invest for the very long term, then that might be a
different story. But for short-term capital profits we want to see
shares increase in value over several months, or at most a couple of
years.
During the infamous Global Financial Crisis (GFC - aka
Global Credit Crunch) of 2008, many blue chip stocks fell in value, and
by mid-2011 (when this web page was first posted) some 3 years later
many
of these blue chip stocks were
still well below their market peaks of 2007-2008. For anyone who is
trying to simply ride out this period of poor market performance, they
could have been waiting a long time.
Then there was the end of the resources boom which hit very hard in
2015, and resulted in a commodities downturn, and many mining and
resources stocks suffering sharp price declines.
In the accompanying price charts
there are many examples of Australian blue chip companies that fell in
price during the GFC. Many of them fell a long way - in the order of 50
to 70 percent. Also included are other companies that suffered
surprising declines at various times
See the material below for details.
|
More information
See
more details about the blue chip stocks that have fallen at various
times (will prompt for Toolbox
member username and password):
Share Market
Terminology
See Brainy's eBook Articles, and the Master
Index list for details.
Or, search
the
eBook Articles.
Robert writes information from time to time about
the market and investing. If you are not a
Toolbox Member, you
can
register to receive useful free information as it is published.
Privacy ensured, unsubscribe anytime.
See
the Testimonials - the things that people say about the
Toolbox and more.
|
Robert
Brain provides various support to both new and
experienced traders and investors.
Who
is Robert Brain?

The toolbox is an arsenal
of weapons to help you tackle the share market.
See a list of contents on
the Toolbox
Gateway page.
The Share Market
- more information about the market and investing and trading.
BTW - Are you Share
Market Ready?
And whatever you do,
beware of the sharks in the ocean!
 class="ht14"
|
Blue
chips falling...
|
BHP Billiton - Massive
disappointment
Who
would have thought that Australia's goliath stock BHP Billiton could
have suffered the share price decline that it experienced in 2015.
Could we have anticipated this? Well, perhaps we might not have
forecast that this cold happen; but the technical
analysts amongst us could have seen a down
trend developing, and protected our capital by closing the
position before it got drastic (perhaps by using the Stop Loss
approach).
See the next price chart below for more details.
|
|
BHP Billiton - protecting our
capital
We could have used key information in the price chart of BHP Billiton
to protect our precious investment capital from the sharp share price
slide from 2012 onwards.
The price chart at right includes some text to explain the concepts of
how we could use the price chart features to do this (Toolbox Members
click for a larger version).
|
|
Consumer Staple stocks are safe -
aren't they?
Now,
it's supposed to be a good idea to buy Consumer Staples stocks because
of their resilience in good times and bad. However, the price chart of
Woolworths (WOW) at right tells us otherwise.
|
|
The
details below talk about the blue chip stocks that fell
during the GFC. And the stocks in the right-hand column are
good examples of what can
happen to blue chip stocks at any time, not only during a GFC.
|
|
Blue
chips that fell more than 50% in GFC...
|
A number of Australia's blue chip stocks fell more than 50%
during the Global Financial Crisis (GFC) of 2008-2010+.
There are two sample stocks shown in the price charts at right:-
- AMP fell 64% in 78 weeks
- CBA fell 60% in 64 weeks
And at the time of writing this material (July 2011), these blue chip
stocks
were still under their highs of almost 3 years earlier.
Actually
there are quite a few blue chip stocks that fall into this
category, not just the two samples here. The collage of four stocks at
right are just four more examples of falling blue chips. These four
fell between 30% and 60% over periods between 26 and 106 weeks. At the
time of writing here, a couple of these are still well down, and a
couple are close to recovering to their past highs (after about 3
years!).
Which stocks are these four?
NOTE: For the purpose of studying "blue chip" stocks here, we are
looking
primarily at the Top 50 Australian stocks - the XFL
index (S&P/ASX
50). Also, there are probably a few more stocks that fall
into this category, and which are not listed here.
|
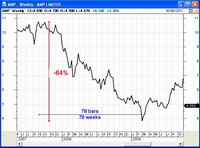
AMP
(click for a larger view) |
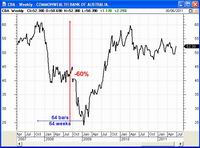
CBA
(click for a larger view) |
See
more in the Toolbox Member area.
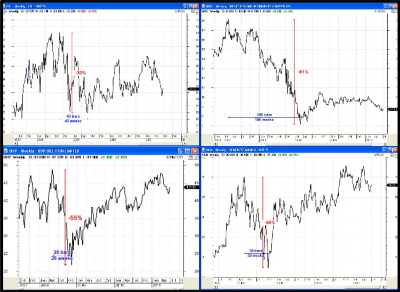
Four more falling blue chips.
See these and more falling blue chips in
the Toolbox Member area. |
|
Blue
chips can remain below past highs...
|
Over the last 25 years or so a number of Australia's blue chip
stocks fell more by a large amount, and did not regain their old highs
for many months, or even for years!!
There are two samples at right:
- Westpac bank (WBC) fell 54% over a 4 year
period, and
took a total of 7 years before it made new highs and stumbled again the
following year.
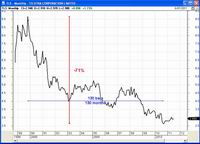
- Telstra (TLS) is that one stock that has fallen
71% over 11+ years, and is still not looking like making new highs
anytime in the near future. Anyone who invested in the initial T1 float
has seen their capital destroyed. Likewise in both T2 and T3, even
after the government and some advisers and brokers recommended investor
partipication.
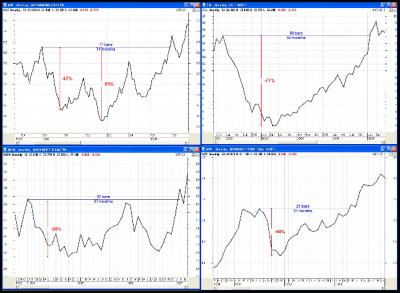
The
collage
view of four stocks at right shows just four more blue chip
stocks that fell a long way, and which took a long time to attain new
highs.
Which stocks are these four?
NOTE: For the purpose of studying "blue chip" stocks here, we are
looking
primarily at the Top 50 Australian stocks - the XFL
index (S&P/ASX
50). Also, there are probably a few more stocks that fall
into this category, and which are not listed here.
|
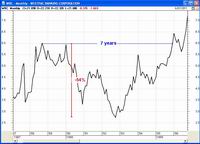
WBC
(click for a larger view) |
TLS
(click for a larger view) |
See
more in the Toolbox Member area.
Four more fallen blue chips that took a
while to recover.
See these and more that took a
while to recover in
the Toolbox Member area. |
|
|


 class="ht14"