
|
Brainy's
Share Market Toolbox (public information) |
 |
Stop Loss |
 |
How to protect investment capital
and minimise losses?
Okay, you have some money invested in shares, or a managed fund, or |
| You are here:
Share Market Toolbox
>
Share Market >
Stop Loss Related links: Robert's Philosophy; Share Market GEMs; Share-Market-Ready; Paper Trading; Market Indexes; Optimising position size; Risk management; Exit strategies; Support and Resistance; Trend-spotting; Funda-Technical Analysis; Sensible Investing; Contrarian Investing Redefined; Technical Analysis; |
Stop Loss - what is it?A Stop Loss is a price level at which you would consider selling your investment. It's purpose is to protect your investment capital by protecting profits, and limiting losses. 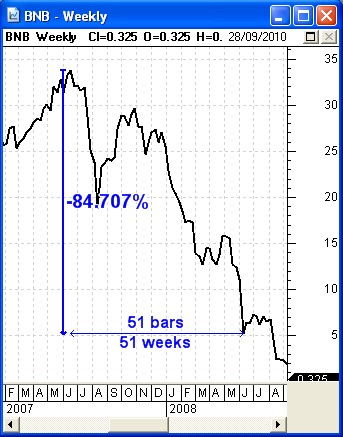
Example#1 - BNB (Babcock n Brown)Take a look at the price chart of Babcock and Brown (code:BNB) at right - click on the image for a larger version that is easier to see.
|
More InformationSlide presentations - There is some preliminary and basic information in some of the slide presentations that Robert has prepared and delivered at various meetings.
Terminology
There are a number of terms that are used in the text at left,
including: Stop Loss, Support, Parabolic-SAR.There is information on these in Brainy's eBook Articles. See the Master Index list for details. Or, search the eBook Articles. The Share Market - more information about the market and investing and trading. 
The toolbox is an arsenal of weapons to help you tackle the share market. See a list of contents on the Toolbox Gateway page. Robert Brain provides various support to both new and experienced traders and investors. Who is Robert Brain?  And whatever you do,
beware of the sharks in the ocean! |
||||||||||
Some samples - Average True Range (ATR).") Many of the
available chart indicators for stops are based on Average True
Range (ATR). The ATR is a dollar value which describes how
far up and down the share price has fluctuated in recent trading
sessions. A common default value is to calculate the ATR over a 14-day
period on a daily chart (or over 14 weeks on a weekly chart).
Many of the
available chart indicators for stops are based on Average True
Range (ATR). The ATR is a dollar value which describes how
far up and down the share price has fluctuated in recent trading
sessions. A common default value is to calculate the ATR over a 14-day
period on a daily chart (or over 14 weeks on a weekly chart).For
example, let's look at a weekly chart of BHP as in
the sample price chart at right with the share price shown as
candlesticks in the lower half and the ATR indicator in
the upper half (click on the chart for a larger image).
Note that BHP was trading between about $35 and $50 until it crashed to $25. The ATR indicator in the upper portion of the diagram shows that the BHP share price was moving from week to week within a range of about $3 to $3.30, and then the ATR value increased to over $4 with the volatile share price move downwards in September-October. .") The
calculation for ATR is not a simple and straightforward
calculation; but the chart indicators do all the calculating for us.
The second diagram at right is a weekly line chart of the Macquarie
Group share price in 2009 as it raced upwards from below $20 to above
$55 (click on the chart image for a larger version). The
calculation for ATR is not a simple and straightforward
calculation; but the chart indicators do all the calculating for us.
The second diagram at right is a weekly line chart of the Macquarie
Group share price in 2009 as it raced upwards from below $20 to above
$55 (click on the chart image for a larger version). The row of dots that rises across the chart is the Wilson ATR Trailing Stop chart indicator, based on a multiple of the ATR value of Macquarie Group. The idea is that near the right-end of the chart in early October 2009 when the share price was in the $50 range, the row of dots is positioned at $49.13, and basically says "if the share price falls to this value tomorrow, then the Stop Loss value is triggered and we should sell". This indicator can be easily adjusted to cope with more volatile, or less volatile, stocks. The Count Back Line (CBL)
Simple CBL - The first price chart sample at right shows a daily price chart of Commonwealth Bank (CBA) in March 2009. Our strategy said to buy this stock next day (12 March), so when studying this chart on 11 March we identified the most recent highest high and placed the CBL tool (in BullCharts software) on this candle - indicated with the asterisk above the candle. Then the CBL tool basically goes back to the on a candle (10th March in this example), then goes back one more last lower lowlower low (on 9th March). The value of the CBL Stop for a long position (the "Long CBL Stop") is then the low of this candle - which is indicated as $26.43. However, this simple determination is not so simple when the previous candles are not consecutively lower as in this example. View the next sample price chart below right. Non-simple CBL - This second example is a daily chart of National Australia Bank (NAB)in late March 2009. Note the following steps to identify the
Long CBL
Stop level:
the
Long CBL
Stop level:
Article TA-6250, "Daryl Guppy - Count Back Line (CBL)" (Toolbox Member password required, otherwise non-members can see Page 1 here). Chart indicators for stopsSome of the more common chart indicators that are used to determine Stop Loss levels include the following:
Initial StopThis is the first Stop Loss level that is calculated at purchase time. It's purpose is to identify the point at which you would exit the stock if the purchase decision turns out to be a bad one. Traders tend to purchase a stock in the anticipation of a rise in price. But if the price falls, and the purchase decision is proven wrong, then it might be prudent to exit the position promptly. Trailing StopAfter a stock purchase, and after the share price rises far enough, it is time to take the Initial Stop position and raise it to protect some of the earned profits. It then becomes a Trailing Stop, and it should be reviewed and raised every few days (or every week or two) to continue to protect more and more profit. Implementing your Stop LossIn order to implement a Stop Loss, there are two basic approaches: More information?For more details about Stop Loss, see the Share Market Toolbox links at the top of the column at right. |
|||||||||||

The information presented herein represents the opinions of the web page content owner, and
are not recommendations or endorsements of any product, method, strategy, etc.
For financial advice, a professional and licensed financial advisor should be engaged.