
|
Brainy's Share Market Toolbox Public Area |
 |
Toolbox eNews
|
|

 |
Robert
routinely publishes a short eNews email with a topic-specific focus to help you learn more about the markets and investing/trading, and strategies and risk management. A feature of Brainy's Share Market Toolbox. |
You are here: Toolbox Gateway > eNews emails > Toolbox eNews email ARCHIVE Related links: About Monthly eNews emails; Toolbox Master Index; Articles Master List; About eBook Articles; |
The Toolbox eNews emailsBelow is the list of focus topics in past editions of the eNews emails.ALSO SEE the Toolbox Master Index for a more extensive list of subjects and topics of material in the Toolbox. And see more information about the Toolbox eNews email and how to get it for FREE! A feature of Brainy's Share Market Toolbox. |
|||
| Publication
Reference Number |
Topic and brief description | ||
| Number 79 |
How to judge a (bear) market
bottom In any bear market situation, or even just
a market correction or a major low in the market, it can be
very advantageous to be able to spot the
bottom of the market as soon as possible
after it has passed, so that we can take advantage
of the rising share prices. If we misjudge it, we might
end up losing a lot of capital as the market turns down
for another leg, so it is very important to be confident
with our call and be watchful in case we were wrong.
(June 2020 email)
|
||
| Number 78 |
Dividend Harvesting - Can it be
profitable? The dividends paid by listed companies can be rather attractive especially for those investors looking for income, rather than capital gain. However, the selection of stocks to buy for the dividend, combined with the timing of any share purchase and sale, is not straightforward and can be fraught with danger. And some shorter term investors utilise a variation of the conventional dividend stripping strategy in order to protect their capital. (Aug 2019 email)
|
||
| Number 77 |
Chart patterns (in price
charts) tell real stories For many technical analysts, it really is a "light bulb" moment when they realise that the price charts, and the patterns in the charts, actually tell stories about the underlying opinions of the market participants. One key way to read and understand the stories in the price charts is by understanding the chart patterns. (March 2017 email)
|
||
| Number 76 |
 Price
trends
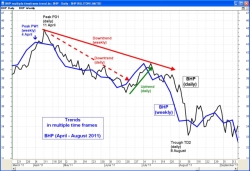
in multiple time frames Price
trends
in multiple time framesOne of the important things to understand about price trends, and looking for an uptrend to follow (because it is reported that the trend is your friend) is that a price trend can exist within a trend, and the two trends can be different. (March/April 2016 email)
|
||
| Number 75 |
Strategy ideas - comparing
share price performance and strength One of the issues for investors from time to time is trying to decide in which one of several stocks to invest. One of the ways to do this is by using some form of comparison of share price performance (or price strength) over a time period. But which tool? And over what time period? This eNews item covers this topic. (Jan/Feb 2016 email)
|
||
| Number 74 |
Santa Rally - What is it? Every
year or not? These days in the approach to Christmas every year, a lot is said about the so-called Santa Rally. But is the Santa Rally (aka Christmas Rally) really real? or was it invented for some underlying alternative reason? (Nov/Dec 2015 email)
|
||
| Number 73 |
Exit Strategies - updated The long-term buy-and-hold investor rarely contemplates selling an investment position. However, the astute investor/trader who wants to protect capital and capture profits carefully considers the possibilities for exit strategies, and ruthlessly implements the chosen strategies. The topic of Exit Strategies has been covered before in these eNews emails below, but this one is an update with some more details. (Sept/Oct 2015 email)
|
||
| Number 72 |
Useful interpretation of the
price charts for profit It is useful to realise that the share market price charts summarise the opinions of the market participants. But it is another thing for newcomers to understand how to exploit this. So, the focus of this month's double edition eNews is on the newbie to technical analysis (TA), to help them understand the usefulness of TA, and how to go forward with using TA for profit. It includes a new web page and an eBook Article, and updates to many others. (July/Aug 2015 email)
|
||
| Number 71 |
Nimble Short Term Investing -
Stock, Sector and Market Analysis There are two new eBook (PDF) Articles this month to provide more details about the Nimble Short Term Investing approach. In particular, focusing on the analysis of stocks, the analysis of sectors, and inter-market analysis. (June 2015 email)
|
||
| Number 70 |
Nimble Short Term Investing
updates In this month's bumper edition we have more information about the Nimble Short Term Investing approach that we first wrote about some months ago. There are four new eBook (PDF) Articles this month, with some updates to a couple of others. Basically, this month's material is more detail about some key aspects of this investing approach. (April/May 2015 email)
|
||
| Number 69 |
Investment portfolio - some
tips This month there are two new eBook (PDF) Articles that follow on further from the recently published material about Nimble Short Term Investing. This month we look at some thoughts and ideas regarding portfolio construction. It includes some thoughts on why there are many differing views about how to construct a share portfolio, and touches on the topics of: asset allocation, sectors, diversification, risk tolerance and portfolio rebalancing. It also includes some discussion on the question: "I want to invest in a portfolio of shares, but how much of my investment capital should I commit to any one share parcel?". (March 2015 email)
|
||
| Number 68 |
Nimble Short Term Investing Following on from the recent interest in the idea of Nimble Short Term Investing, this month's focus announces the first in a series of new eBook (PDF) Articles on the topic, and the recent Slide Presentation and updated web page. (Feb 2015 email)
|
||
| Number 67 |
Chart patterns - tell us all It is useful to remember that:- "Price charts summarise the underlying opinions of the market participants...". So one key way to read and understand the stories in the price charts is by understanding the chart patterns. For this month's focus we have posted a new web page on Chart Patterns, and revised and updated a number of eBook Articles. (Dec 2014 / Jan 2015 email)
|
||
|
|||
| Number 66 |
Nimble Short Term Investing The term "Nimble Short Term Investing" refers to a particular investing style that is applicable to investing in the equity markets (the share market). This investing approach has several underlying assumptions, and adopts specific views and interpretations. Some of it's underlying principles challenge conventional wisdom. (Nov 2014 email)
|
||
| Number 65 |
Technical analysis - what is
it? How can I profit? This month's eNews continues the theme from the last couple of months, with the aim of providing some good information (and some tips) to help both newbies and intermediate investors and traders. There is a long list of links to useful and free pages in the Share Market Toolbox, including: Investing Tips, Share Market Success Secrets, and more. As well as infromation on one new and one updated public presentation, and two new Share Market GEMs (ie. Wall Street words of wisdom). (Sept/Oct 2014 email)
|
||
| Number 64 |
Technical analysis - what is
it? How can I profit? This month's eNews is a follow-up to last month's (below). For anyone who has started their journey of learning about technical analysis, they have probably discovered over time that the subject is rather broad. And it can take a while to discover all aspects. And along the way, one challenge is to work out how much we need to learn about the subject. The reality is that we only need to focus on one or two aspects of technical analysis in order to be successful. And they can be whichever aspects we find easiest to understand and relate to. But it pays to be at least aware of all the different aspects so as to make a wise choice going forward. So this month's eNews addresses exactly that - explains where to start, and includes the new slide presentation, and reference to the Share Market Ready check list. (Aug 2014 email)
|
||
| Number 63 |
The stories in the price charts
- Understand the stories, and pulling it all together  Many people have seen the light, and can understand that the opinions of market participants are recorded in the price charts, and that the price chart does indeed tell a story. [This is explained in the chart at right - click on it for a larger version with more details and comments, and see the explanation here.] The information available with this month's eNews includes four new or updated eBook Articles which explain how to analyse the price charts, and keep a sensible record of your own observations to make it easier to come back later and review the analysis. (July 2014 email)
|
||
| Number 62 |
Ranking stocks by performance Sometimes there is a need to rank a list of stocks in order of performance. This month's eNews discusses the situations when this might happen, the considerations, and exactly how to go about quantifying share price performance, and ranking a list of stocks so the top performers are on the top of list. The information available includes a set of presentation slides (to be updated in July), as well as three new eBook Articles. (May/June 2014 email)
|
||
| Number 61 |
(a) Invest for enjoyment!? (b)
More on position size and (c) Hull ROAR indicator There are three topics covered this month:
(April 2104 email)
|
||
| Number 60 |
 Optimising
Position
Size and Position Size Calculator Optimising
Position
Size and Position Size CalculatorWhen investing in the share market, it can be very beneficial to "optimise" each position size, and to risk the maximum amount that you have already decided you are prepared to "risk". This is taking maximum advantage of favourable price movements to maximise profits. See all the details in eNews #60. (March 2014 email)
|
||
| Number 59 |
Exit Strategies (Part 3) This month's eNews focus continues the topic that we started a few months ago, and includes updates to recent eBook Articles, and one new eBook Article. Discussing how to utilise key technical analysis tools to develop effective exit strategies. [The topic of Exit Strategies has been updated with more material in Nov 2015.] See all the details in eNews #59. (Jan/Feb 2014 email)
|
||
|
|||
| Number 58 |
Santa Rally - True or Wall
Street furphy? These days in the approach to Christmas every year, a lot is said about the so-called Santa Rally. But is the Santa Claus Rally (aka Christmas Rally) really real? or was it invented for some underlying alternative reason? In researching for this topic (and the new web page), a few other ideas started to crystallise, regarding a healthy scepticism for the Finance Industry - see the comments in the eNews email... See all the details in eNews #58. (Dec 2013 email)
|
||
| Number 57 |
IPOs - Are they worth a look?
Or are they capital killers? There are more and more news stories now (late 2013) about the flood of Initial Public Offerings (IPO) that are coming to the market. We seem to be at that point in the economic cycle where companies are feeling like it is the right time to come to the market and look for some cash. But are they worth it? Should retail investors invest their hard earned cash in IPOs? In reality it might not be a good idea at all. You might be surprised at how often an IPO flops. See all the details in eNews #57. (Nov 2013 email)
|
||
| Number 56 |
Exit Strategies (Part 2) This month's eNews focus continues the theme from last month, with some updated materials, and some new eBook Articles. See all the details in eNews #56. (Oct 2013 email)
|
||
| Number 55 |
Exit Strategies Sometimes it is best to sell and lock in profits; and sometimes we just need to sell to minimise the unfolding losses and protect our investment capital from further declines. The topic of exit strategies is one that is not discussed enough. So this month's focus leverages off recent brain storming discussions with the BullCharts software User Group, and lists a whole lot of possible exit strategies - along with brief comments. The updated 8-page eBook Article this month is free to everyone. Next month we will expand on some of the mentioned strategies (just for Toolbox Members). In the meantime, see all the details in eNews #55. (Sept 2013 email)
|
||
| Number 54 |
In a falling market, keep
stocks for dividends? or sell to protect capital? When the market is falling, as in a raging bear market, is it best to hold falling stocks for the dividends, or sell to protect profits and capital? We know that bear markets and market corrections come around too often (see the details). This month's eNews leverages off an updated version of a public presentation, and includes references to several eBook (PDF) Articles. See all the details in eNews #54, and links to the new/updated web pages. (July/Aug 2013 email)
|
||
| Number 53 |
Protecting your capital - Part
2 This month's eNews email follows on from last month's with more details on protecting our investment capital. This includes a new eBook (PDF) Article, and information on utilising "price alerts" to flag that our Stop Loss has been breached - utilising both broker alert tools, and charting software features like the BullCharts Alerts tool. See the details in eNews #53, and links to the new/updated web pages. (June 2013 email)
|
||
| Number 52 |
Protecting your capital This month's eNews email is along the subject line of the ATAA National Conference later this month. To help put this subject into perspective, it incorporates the topics of money and risk management, managing investment position sizes, utilising a Stop Loss, and gauging market mood. There are more topics, but they will have to wait until next month. See the details in the May eNews email, and links to the new/updated web pages. (May 2013 email)
|
||
| Number 51 |
Sectors, stock comparison, and
the RSC charting indicator This month's eNews focus is supporting Robert's contribution to the May 2013 ASX Investor Update email newsletter. This discusses the share market GICS sectors, and in particular the finance sector and its index, and how the Relative Strength Comparison (RSC) charting indicator tool can be used to gauge the relative performance of two stocks, or a stock and its sector index, or a sector compared to the market. (April 2013 email)
|
||
| Number 50 |
Investing and Trading Tips During the GFC (Global Financial Crisis) of 2008, and the years that followed, many investors probably lost faith in some of the so-called professional advice and wisdom that they keep hearing. To help investors cope with this, and understand the underlying issues, there are some new web pages this month: Share Market Success Secrets, and Investing Problems and FAQs, and another one: Share Market Investing and Trading Tips. (Feb/March 2013 email)
|
||
| Number 49 |
(1) Investment options and (2)
BullScript This month's eNews focus is on two separate topics. (1) Investment options - Many people who are new to the markets, or who have been struggling for a while trying to make sense of the markets, might very well want to know more about the alternative investment methods - shares, options, bonds, bank account, property, etc. One of our new eBook Articles this month discusses this very topic. (January 2013 email)
|
||
|
|||
| Number 48 |
 The "4
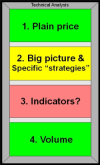
Windows" analysis approach The "4
Windows" analysis approachThe "4 Windows" share market analysis approach is a framework intended for both new and experienced investors and traders to firstly remind us of the breadth of the field of technical analysis, and also to serve as a checklist to help us remember key considerations for stock (and index) analysis. In this month's eNews focus we introduce a new web page, and a new eBook (PDF) article. (Nov/Dec 2012 email)
|
||
| Number 47 |
Investment Exit Strategies This month's eNews focus is on the topic of strategies for exiting investment positions. That is, what triggers can we look for, and what considerations are useful when considering an exit from a share market position? (Oct 2012 email)
|
||
| Number 46 |
Investing in Cyclical Stocks This month's eNews focus is on the topic of cyclical investing. It is explained in the new Investing in Cyclical Stocks web page, and accompanies another contribution to the monthly ASX Investor Update newsletter. Also see updates in eNews #55 above. (Sept 2012 email)
|
||
| Number 45 |
Trends and Trend Strength This month's eNews focus is on the topic of share market price Trends, and on Trend Strength. Not only is it both important and useful to be able to spot a trend, but also to have an idea of the relative strength of the trend. There are several technical analysis chart tools and indicators to help do this. This is an update to the material in eNews #27 below. (August 2012 email)
|
||
| Number 44 |
Breakouts This month's eNews focus is on the topic of price and chart breakouts. It is all explained in the new breakouts web page, including reference to the pending August edition of the ASX Investor Update newsletter for which Robert has authored another contribution, as well as three eBook Articles (two of which are brand new), and a comment about the Volume Moving Average indicator. The new BullCharts Article also refers to the BullCharts Price Volume Breakout Marker indicator which can readily flag an increase in both price and volume - an increase by an amount that the user can specify. (July 2012 email)
|
||
| Number 43 | Risk and Money Management This month's eNews focus is consolidating and updating past Articles on the difficult topic of Risk and Money Management. It includes reference to a number of sub-topics including:
(June 2012 email)
|
||
| Number 42 |
Quality preparation for the
markets - Are you "Share Market Ready?" This month's eNews focus is consolidating and updating some past materials on the topic of sensible and quality preparation for successful investing in the markets. The "Share Market Ready" web page is updated, and information explaining why an investing / trading strategy is very important, as well as a discussion about discretionary trading. See the details in eNews #42, and links to relevant web pages, including the Are you Share Market Ready? web page. (May 2012 email)
|
||
| Number 41 |
Strategy - utilising Market
Sectors, GICS codes, and understanding basic Dow Theory. This month's eNews focus is all about using an investing strategy based on finding strong sectors in the market, or perhaps strong stocks in strong sectors. We can do this by understanding the GICS coding system, and details about market sectors. Includes a discussion about capitalisation indexes versus sector indexes. See the details in eNews #41, and links to relevant web pages. (April 2012)
|
||
| Number 40 | Investing strategy helpers:- ATR (Average True Range), Trailing Stop Loss (to protect profits and investment capital), and BullCharts multi-scans. There are many tools available to assist the chartist, and in this month's eNews email we look at several of them, as an extension of the recent information on Robert's JB+AH Strategy. See the details in eNews #40, and several links to relevant eBook Articles. (March 2012 email)
|
||
| Number 39 |
Useful tips to reduce risk
- with sound risk and money management. How to reduce risks, The 2 percent rule, Risk and reward, Position size + calculator, and the invaluable Stop Loss. See the details in eNews #39, with a long list of eBook Articles on this topic, and information about the set of presentation slides from a public presentation. Also see the material in eNews #43 above. (Feb 2012 email)
|
||
| Number 38 |
Robert's JB+AH Strategy (a sample
strategy) Robert has developed a strategy for the selection of shares to trade, using aspects of two well known technical analysis chart indicators (the Jim Berg Volatility Profit Taker indicator, and Alan Hull's Range indicator). For all the details, see eNews #38, with links to relevant eBook Articles. (Jan 2012 email)
|
||
|
|||
| Number 37 |
Stock Liquidity This is a follow-up to the recent (September 2011) eNews email, with more details, and a real case study demonstration of how to find liquid stocks, using Robert's Liquid List as the example. See the details in eNews #37, with links to Premium Toolbox Member information, and access to Robert's own Liquid List of stocks (updated each month). (Dec 2011 email)
|
||
| Number 36 |
Money and Risk Management, and
the 2 Percent Rule With sound money and risk management, it is possible to maintain a lot of control over our investments, and guard against losses. One aspect of this is the so-called "2 percent rule". See the details in the November eNews email, with links to relevant eBook Articles. Also see the material in eNews #36. (Nov 2011 email)
|
||
| Number 35 |
Risk Management and Optimising Position Size (+ Calculator) The issue of risk management is something that many investors and traders tend to overlook - probably because they don't know enough about the topic. Closely related to this topic is the issue of position size for any individual investment in a parcel of shares. Many people simply allocate a fixed dollar amount to each share parcel (eg. $4,000 worth). This is probably not the most optimum parcel size, considering each person's own situation regarding investment capital and risk tolerance. See the details in eNews #35, and links to an eBook Article, and the Tools section of the Toolbox to download a spreadsheet Position Size calculator. (Oct 2011 email)
|
||
| Number 34 |
Stock Liquidity - the importance of avoiding
illiquid stocks. If we buy a parcel of shares with the intent of selling them for a profit, then we need to be sure that when we sell them there will actually be enough buyers on hand to buy them. We don't want to be stuck with them, nor do we want to sell them for a lower price than we want. Some of the shares we might want to buy might trade less than twice each week on average, and we don't want to be stuck with them. The topic of stock liquidity is very important. See the details in eNews #34, and links to useful information including the Stock Liquidity web page in the Toolbox. Also see the update in eNews #37 above. (Sept 2011 email)
|
||
| Number 33 |
 Candlestick
interpretation
and "candle addition" Candlestick
interpretation
and "candle addition" This month's eNews email provides more information about interpreting underlying market mood and sentiment using candlesticks, and introduces the topic of "candle addition", as demonstrated in the diagram at right where the two left-hand candles can be "added together" to produce the single "compound" candle on the right. See the details in eNews #33, and links to more information in the Toolbox. (August 2011 email)
|
||
| Number 32 |
 Candlestick charts and
patterns Candlestick charts and
patterns Last month's eNews email explained that share price charts hide a wealth of information about the mood and sentiment of the market, with clues about likely future share price movement - in the chart patterns in particular. In this month's eNews email that theme is continued by explaining that even more information is available in the candlesticks - both the features of individual candles, and also in the patterns of multiple candles (like the Hanging Man pattern shown at right). .")  See
the
details in eNews #32, and several links to more details
about candlestick patterns, including downloadable mini-posters
showing the common candlestick patterns. See
the
details in eNews #32, and several links to more details
about candlestick patterns, including downloadable mini-posters
showing the common candlestick patterns.(July 2011 email)
|
||
| Number 31 |
Chart patterns - Tops, Shoulders, Saucers In the world of technical analysis, if we consider what some people refer to as "primary analysis" where we only look at the plain price chart without indicators, then what we call "chart patterns" can actually tell us a lot about the price action, and the underlying mood and sentiment of the market. Their usefulness is often under-rated, and in fact many professional traders rely heavily on chart patterns. See the details in eNews #31, and links to several eBook Articles on chart patterns. Also see the newer eNews #67 email. (June 2011 email)
|
||
| Number 30 |
Darvas Box and related Tools Last month's article was an introduction to Nicolas Darvas, and described how he spent 5 years playing with the market winning a small fortune before losing it. The eNews email summarised his eventual strategy that he devised after this 5 years of practise, and includes his views about the usefulness or otherwise of brokers, advisers, newsletters and fundamental analysis. See the detail in eNews #30, with links to Toolbox Articles explaining the chart tools based on his approach. (May 2011 email)
|
||
| Number 29 |
.") Nicolas Darvas -
"How I Made $2 million in the
Stock Market" Nicolas Darvas -
"How I Made $2 million in the
Stock Market"In his all-time best-seller, "How I Made $2,000,000 in the Stock Market", Nicolas Darvas explains all the detail, and all the steps along the way, to describe how he did it over just an 18 month period, while he worked touring the world as a professional dancer! See the detail in eNews #29, with links to the 8-page eBook Article explaining his approach and strategy. (April 2011 email)
|
||
| Number 28 |
Price chart support and resistance For a number of reasons, there are often price levels on a share price chart that are considered to be levels of Support, or Resistance. Most of the time these levels can be explained based on the psychology of the investors and traders in the market on the day. See a short discussion in eNews #28, and more details on the Support and Resistance web page. (March 2011 email)
|
||
| Number 27 |
Trends -
trend-spotting, uptrends, exploiting trends In the big wide world of investing and trading, there are literally thousands of different strategies that can be deployed. Many of these rely on the idea that "the trend is your friend". That is, if you can spot a rising trend, and join the trend, then you can ride the trend until it has finished. See introductory information in eNews #27, and more details on the Trends web page. The ideas related to trends also touch on Dow Theory. Also see the later update on trends in eNews #45 above. (Feb 2011 email)
|
||
| Number
26 |
Stop Loss -
What it is and how to do it Many successful investors and traders have dearly embraced the concept of a Stop Loss. They know it is critically important to achieving success in the market. They understand the concept, and they implement it religiously. (Basically a price level below which we believe the stock should not trade, and if it does, we will sell forthwith to protect capital.) See introductory information in eNews #26, and more details on the Stop Loss web page. (Jan 2011 email)
|
||
| Number 25 |
Announcing the changes to the monthly eNews email. (Dec 2010 email)
|
||
| back to top... | |||
The information presented herein represents the opinions of the web page content owner, and
are not recommendations or endorsements of any product, method, strategy, etc.
For financial advice, a professional and licensed financial advisor should be engaged.