|
Brainy's
Share Market Toolbox (public information) |
One of the ways to select stocks for investment
|
|||||||||||
IntroductionWhen we make investment decisions about which stocks to include in our portfolio, there is a bewildering variety of very well-accepted approaches and strategies from which to choose. One of these approaches considers the current state of the business or economic cycle, to help choose either a so-called cyclical stock, or a defensive stock, as appropriate. It all sounds good in theory. However, many investors choose to ignore the cycles, and select stocks using a type of bottom-up approach. So, which approach should we use? The information below is an edited version of the material submitted for publication in the ASX Investor Update newsletter in October 2012 (see an archived copy of the published article). For more information, see the eBook Article ST-6310 "Investing in cylic stocks" (will prompt for Toolbox Member username and password). Cyclic investing — is easy?
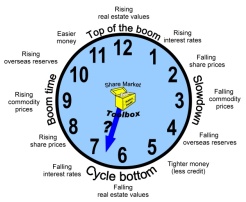
Remember there are four stages to the economic cycle:
There are many indicators of economic activity to help us determine the current time on the investment clock; but keeping track of them is not easy (see the ASX article for more details). Cycle bottom and possible recessionIn late 2012 the Australian market index was at the same level as 7 years earlier, and still 35% below the peak of late 2007, many traditional investment theories were considered to now be out the window.The “buy-and-hold” investment approach? - No longer a good idea. Dividend income? - If only investors would do the maths they might see that there are times when it is more prudent to liquidate some equity investments and deposit the cash in the bank. Investors are different to fund managersThere are some key differences between professional fund managers and retail investors, which mean that the investment strategies and principles of the fund managers might not necessarily apply to retail investors. (See the full ASX article for details). |
More InformationMaterial published by the ASX in their monthly Investor Update newsletter. eBook Articles - Share Market Toolbox Members can see more details in the following eBook Articles:(Toolbox non-Members can see the "Page 1" of these eBook Articles from the Table of Contents)

The toolbox is an arsenal of weapons to help you tackle the share market. See a list of contents on the Toolbox Gateway page.  And whatever you do,
beware of the sharks in the ocean! |
||||||||||
The case for bottom-up stock-pickingOne key principle of stock selection using some basic aspects of the price chart is to avoid a stock whose share price is exhibiting a downtrend. The statistics show that once a downtrend is confirmed, then it is likely to continue until it is confirmed to have finished. So, why would we buy a stock while it's share price is falling? This is investing on a wish and a prayer, and just doesn't make any sense. Don't forget, a cheap stock might get cheaper, and cheaper, and might go the same way as: ABC Learning Centres, HIH, Allco Finance, Babcock and Brown, Timbercorp, Nylex, Great Southern and more. By all means we could shorten our list of candidate stocks by running some sort of quality filter across the long list of possible stocks. For the Australian market of more than 2,000 equities, a quality filter might reduce the list to 400 or 500 stocks. And if we choose to invest only in liquid stocks so that we have a better chance of selling when we want to sell, then the list might come down to about 300 stocks. The quality filter approach might look for stocks with a consistent return on equity, and a low debt to equity ratio, and perhaps a low PEG ratio indicating they are under-valued with good growth expected. We could then use simple technical analysis to identify the rising stocks, regardless of the sector. And provided we use sensible risk and money management methods - including a sound Stop Loss approach - then our chance of success is increased. This hybrid approach of using some key fundamental analysis criteria to identify quality stocks, and using technical analysis for timing, can be called funda-technical analysis. But how do we find the great stocks that are rising strongly? That's another story... (see more details on technical analysis) Introduction to sector indexes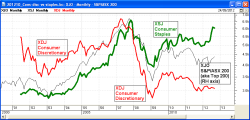
Most of the listed equities on the Australian market are allocated a GICS code (Global Industry Classification Standard), and all stocks in the S&P/ASX 200 index (XJO) are also listed in the relevant (GICS) sector index. See more details about the GICS standard. Two of these key sector indexes are the Consumer Staples sector index (XSJ) and the Consumer Discretionary sector index (XDJ). The chart here shows these two indexes and the XJO over the period they have existed - from 2000 to now (click on the image for a larger version in a new window). Notice that after the market fell heavily in 2008, the XSJ (staples) recovered faster, and higher, than the rest of the top 200 index, and much better than the discretionary index (XDJ). This means that by selecting stocks at the appropriate time from the XSJ index we do have a greater chance of better profitability. But note that this index currently has only 7 stocks. If we want to select from similar consumer staples stocks that are outside the top 200 (currently 54 stocks in the whole of the market), then we can search for those with a similar GICS code - that is, a GICS sector code of 30, or simply peruse the published list (this is easy with some stock selection and charting software). Cyclical stocks and sectorsIf we thought that a country's economy had passed through the bad times and had turned the corner, then we might want to bias our investing towards cyclical stocks - such as media or transport stocks for example. It is easy to find a list of these stocks with appropriate software or tools; but in the Australian market we don't have a sector index that exactly matches these market sectors so it is not easy to compare a stock to a desired sector index. For instance, there are currently 26 transport-specific stocks listed on the Australian market. They are grouped with another 200 stocks in the Industrials GICS sector (GICS sector code 20), and some of them are bundled with 34 other stocks into the XNJ sector index (S&P/ASX 200 Industrials) which is easy to chart but perhaps not very useful in the current context.
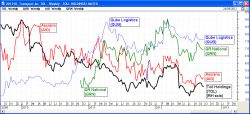
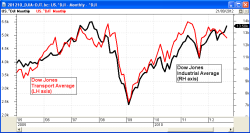
To find investment candidates in our preferred cyclical market sectors, we might need to use a clever market scanning tool, or search for all stocks with a specific GICS sector and industry-group code (available via the ASX web site - menu option: Products > Indices). Compare the averagesOne of the six key tenets of Dow Theory explains that for a bull market to be under way the Dow Jones Industrial Average (DJIA) index and the Dow Jones Transport Average (DJTA) index both need to be moving together. The logic is that if the broader economy which is represented in the Industrials Average is performing well, then the Transport Average should also be performing indicating that goods are being shipped around the country. See more details about Dow Theory and comparing the averages.
Strong stocks in weak sectors?We are often encouraged to look for strong stocks in strong sectors - a very sound approach that certainly increases the likelihood of investing success. The chances of any of these stocks performing poorly is very low, so our chance of success is increased - but there is a downside. When we ignore all the stocks in weak sectors, we are also ignoring any strong stocks in those weak sectors.
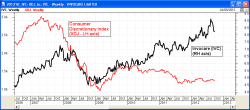
The chart here shows the performance of Invocare versus the XDJ index and it clearly shows that IVC's share price fell from about $7 to $4.50 in 2008 during the GFC, but has then rallied to new all-time highs above $8 in the four years since. This is while the Consumer Discretionary index has languished. This is a clear demonstration of the stocks that we can miss if we only focus on strong sectors. Conclusion?Investing with the economic cycle can be very much hit-and-miss, especially if we misjudge the time on the investment clock. Also, investing in strong stocks in strong sectors is a relatively low-risk approach with limitations. Searching for any rising stock in any market is higher risk, but can be rewarding. Perhaps we might as well ignore the investment clock? More informationFor more details on this topic, see the list of references above right... |
|||||||||||
|
The information presented herein
represents the
opinions of the web page content owner, and ©
Copyright 2015, R.B.Brain -
Consulting (ABN: 52 791 744 975).
|
|||||||||||


