|
Dear Reader,
This month's email is
going to all Toolbox Members, and to the people who have registered to
receive occasional information about the Share Market. (Any
non-member who no longer wants to receive this material can simply
unsubscribe using the SafeUnsubscribe link at the bottom - or just
Update Your Profile to change your interests.)
Last month I explained that share price charts hide a wealth of information about the mood and sentiment of the market, with 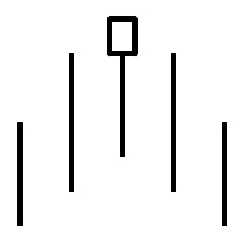 clues
about likely future share price movement - in the chart patterns in
particular. And this month I continue that theme and explain how even
more information is available in the candlesticks - both the features
of individual candles, and also in the patterns of multiple candles
(like the Hanging Man pattern shown at right). clues
about likely future share price movement - in the chart patterns in
particular. And this month I continue that theme and explain how even
more information is available in the candlesticks - both the features
of individual candles, and also in the patterns of multiple candles
(like the Hanging Man pattern shown at right).
This month's focus below is the
seventh one in the current series and
explains the ins and outs of
candlestick charts and candle patterns
including the psychology that creates
long or short candle features.
The monthly focus in the last few months has been:
For the benefit of all the new readers this month,
useful information in the last few month's emails is
available in the email archive (no password needed).
Over the next few months, the topics of focus in this monthly eNews email will include:
- Money and Risk Management, including position size (ie. how to minimise losses and maximise profits).
- More on candlestick patterns.
Please read on....
|
|
|
This month's focus:
Candlestick charts and patterns
 | | Candles |
When
we look at the price charts of any stock or index, we could look at a
simple line chart, or a bar chart, or a candlestick chart.
On
a Daily line chart, the chart simply joins together the close prices at
the end of each day. There is no indication of the range in price
during the day. Many people are happy to look only at line charts; but
they are missing out on all the extra useful details that are available
in the candles. It can be so very useful to see how much the price had
varied during the period.
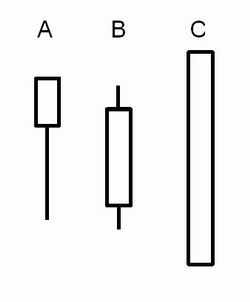
For
instance, in the simple diagram above right, candle A has an average
sized candle body, and only one tail which is a rather long lower tail.
This suggests that sellers dominated the action during the day, but had
lost interest (or had finished their selling) by the end of the day.
This can be seen as a "rejection of lower prices". If this candle
appears in a down trend, it is a suggestion that the down trend could
be weakening. In an up trend it can forewarn of a possible reversal in
the trend.
In
the same diagram, candle B is a more normal candle with a reasonably
sized body and average length tails. But candle C is a very tall candle
with no tails - known as a Marubozu (Japanese for "shaven"). The white
version of this candle is very bullish, indicating a lack of sellers in
the period, and the black version is very bearish indicating a lack of
buyers in the period.
|
|
Summary links for Candle details
In the sections below there are some comments about how to
identify candlestick shapes and patterns, including the psychology at
play.
But here is a summary list of useful links (most for Toolbox Members, requiring username and password):
|
|
How to spot the candle patterns?
One of the things that puzzled me for a long time when I
started studying candle patterns, was that there appears to be a long
list of different patterns, and it is so hard to work out which pattern
is which, and what they all mean. [Can you relate to that?] There is a
lot of web-based material available that describes many candle
patterns, but nothing to help explain how to easily identify the
various candle patterns - until now! If you are looking at a
candle chart, and wondering if there is a meaningful candle pattern on
the chart, then keep reading. There are a couple of good steps to help
you quickly work out if you have spotted a relevant candle pattern. I
have described these steps under the Candle-Spotting heading here. And further down that web page are some lists and diagrams of patterns to assist, including a simple chart of single candle shapes. Click on the image below for a larger version (and Toolbox Members can click here to view a printable PDF version with pattern names included). 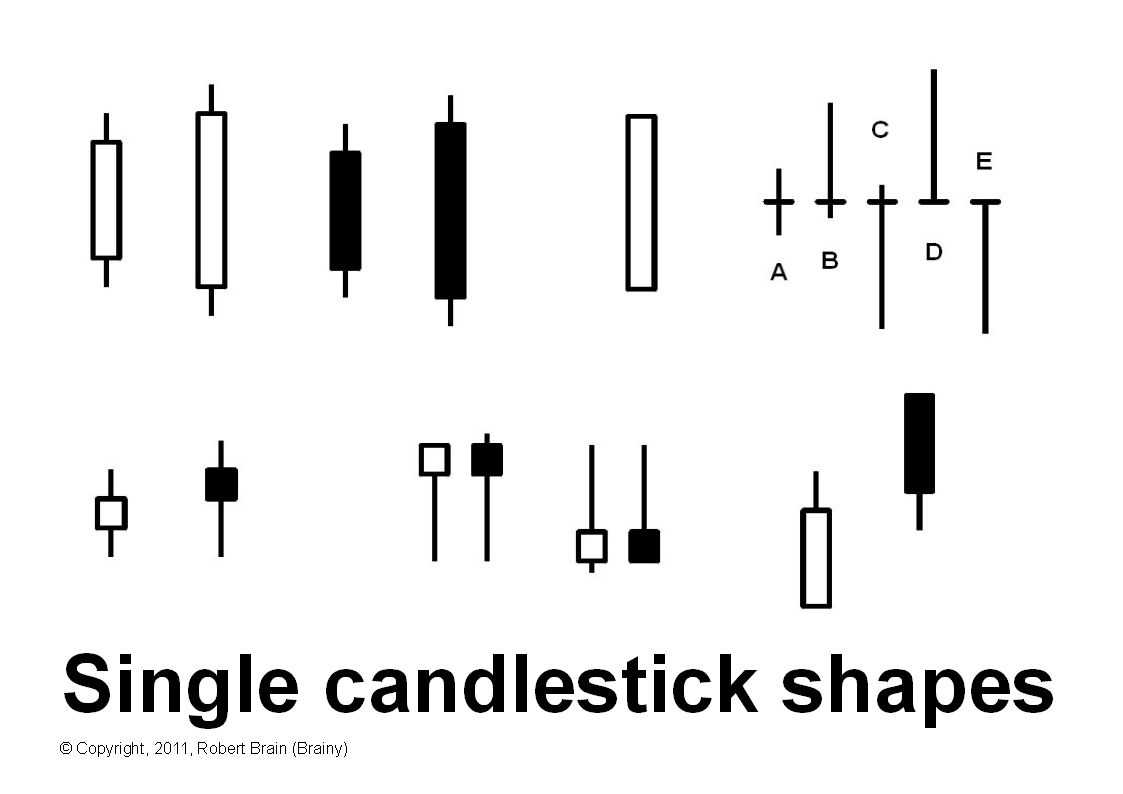 | | Single candle shapes |
To help understand the importance of key features like short or long candle bodies, and short or long tails, I have a description of Candle Features here. This explains the psychology at play, and helps it all make sense. The
next step to identify a possible pattern on your chart is to identify
whether a clear up trend or down trend, is in place. If there is a
trend, then the next step eliminates many possible patterns and
shortens your target list. I have two charts that summarise the key patterns in UP trends, and patterns in DOWN trends,
and the chart patterns are grouped into similar groupings to make it
easier. Good descriptions for these are included (for Toolbox Members)
on the UP trends page, and the DOWN trends page.
|
|
Candlestick eBook Articles
We already have a couple of eBook (PDF) Articles on the topic of Candlesticks and Candle Patterns:
There are now a total
of 102 Articles in this eBook collection of Articles (423 pages of
information)! You can see the Master List of all Articles here, or the Detailed Topic Index here. And don't forget to see the revised Table of Contents pages (see links in side-bar at right).
|
|
eBook (PDF) Articles - Summary
Over the last two years I have accumulated quite a collection of eBook (PDF) Articles
on three subject areas - Share Trading/Investing, Technical Analysis
and BullCharts software (actually more than 400 pages of material
in more than 100 articles). These Articles are invaluable for both new
and experienced investors and traders. I
am now writing brief monthly notes in this eNews email to
highlight specific Articles on targeted topics. I am also writing new
Articles and updating existing ones as required. For more information
about the changes, see the December 2010 eNewsletter email in the eNews email Archive. For more information see: |
|
|
Article front pages
As of early January 2011 with the change in publishing approach for 2011, I significantly revised the Introduction Article and the Overview Article for each of the three subject areas. You can see them here:
- Share Trading / Investing:
|
|
Any problems?
What
if you have some sort of problem with accessing the Toolbox and any of
these Articles? Or maybe the Username and Password doesn't work. If
there is any problem at all, simply contact me by email or phone. The
best email address for this is: support@robertbrain.com.
Occasionally emails disappear - the system thinks they are spam, or the
ISP might think they are spam. If I don't reply within a day or so,
please contact me by other email address or phone. |
|
In Closing
There is nothing secret in this
email, so feel free to forward it to someone if you think they might
benefit from the information, or from being a Toolbox Member. The
easiest way to do this is to use the "Forward Email" link at the bottom.
I
am also confident that my Toolbox Members won't be sharing their
username and password with non-members. It is not fair that I spend all
this time preparing the materials, and then my Toolbox Members pay
money to have legitimate access, only to let some people pay nothing to
read and view the details.
Please
feel free to email an individual Article to others as a sample; but if
they want online access to all the materials, it is pretty cheap, so
they should subscribe as a Toolbox Member. There is information about Toolbox Membership in the Quick Links section at right.
Happy to receive feedback, or suggestions for new content or improvements.
Until next month,
Happy investing or trading,
Robert B. Brain
(mobile: 0438 355 910)
ps: watch out for the sharks in the ocean!
|
|
|
|
|
|
Feedback?
I am always very happy to receive feedback about the Toolbox, and the articles and weapons therein.
Please feel free to contact me by email or phone.
How to contact - click here.
|
|
 Brainy's Share Market Toolbox