More
Information
For more information and downloadable information sheets
on this topic, see:
Robert writes information from time to time
about the market and investing. If you are not a
Toolbox Member, you can register
to receive useful free information as it is
published.
Privacy ensured, unsubscribe anytime.
See
the
Testimonials - the things that people say
about the Toolbox and more.
|
The
Share Market - more information about the market
and investing and trading.

The toolbox is an arsenal of weapons to help you tackle
the share market.
See a list of contents on
the Toolbox
Gateway
page.
Robert Brain provides
various support to both new and experienced traders and
investors.
Who is Robert Brain?

And whatever you do,
beware of the sharks
in the ocean!
|
Your stock universe - A guide to selecting
investing/trading stocks
When investing (or trading) in equities (or shares) in any
equity market, there are many candidates to choose from. In the
Australian securities market alone (the ASX) there are more than
2000 equities to choose from - including both companies
and ETFs. So how can you decide which of these to invest
in? Across all of the available equities, there are a
number of different characteristics which might help you to make
your decisions. But this also applies to equities in any
overseas markets, such as the US equity market where many
Australian investors and traders seek out good gains.
Many investors and traders might firstly compile a list of
equities which they will call their own "stock universe". Then
they will make a selection from that list based on a variety of
other criteria, perhaps depending on the current performance of
the security's share price. The important point here is that
having compiled a "stock universe" list, they will tend to
ignore any equities that are not on the list.
By compiling such a list, this can save time in the search, and
it will simplify the investment decision process, and help to
reduce some of the distractions that can often cause confusion.
Stock selection - two step process
Many investors and traders might do two things:
- One or more "stock
universe" lists - Prepare a list of their own
"stock universe". But they might have more than one list, in
which case there would be a trading strategy that describes
how to use each list. For example, one list of speculative
stocks might be traded with just a small portion of the
investment capital, while another list of large-cap blue chip stocks might be used for
longer term and more stable investment returns, such as in a
superannuation (SMSF) portfolio.
- Separate strategies
- Have a separate strategy that describes exactly how an
investment would be made in a stock within each stock
universe. Each stock universe would potentially have a
separate strategy to guide the investment. The difference
might be the holding time, or the level of risk.
WHY bother to prepare a "stock universe" list?
Many investors and traders don't prepare a stock universe list.
They simply look across all stocks in the market, and apply a
filter (one or more filters) to produce a list of investment
candidates. If you do work through the process of preparing a
list, then you will probably find the following advantages:
- It will help you to stay focused on the investing/trading
activities.
- It will be easier to prepare a trading/investing plan that
is suitable for a specific stock universe, because the
strategy might be a little different for a different stock
universe.
- It will help to avoid distractions. Many investors/traders
are happy to read the latest news and announcements about
their "favourite" stocks. But if we invest in potentially
any stock in the market, then there is too much news to
read. By having a stock universe, it will help us to decide
which news to read, and which news to skip over.
What if I don't prepare a "stock universe" list?
It's quite okay if you don't prepare a "stock universe" list.
You can still search through the whole market for
investing/trading candidates. And you might be distracted by
stocks that don't really fit your stock selection criteria.
That's okay. Some people would say that this is not the smartest
way to operate. But you will probably end up at about the same
end-point eventually.
HOW to compile your own "stock universe" list:
So, how do we decide which equities to include in our own "stock
universe" list? Here are some considerations for investing (or
trading) in equity markets around the world. The "stock
universe" might simply be any of the following:
- Large-caps - The
stocks in a particular large-cap index For example, the XJO
("Top 200") index in the Australian market, or the
S&P500 in the US market. These tend to have somewhat
stable share prices over the short term - ie. less
volatility.
- Mid-caps -
A selection of mid-cap stocks.
- Small cap stocks -
Smaller cap stocks (eg. the Small Ordinaries index in
Australia, or in the US market the stocks in the Russell
2000 index).
- Sector specific -
The stocks in a particular market sector (eg. Health Care,
or Technology), or make a conscious decision to ignore the
stocks in a particular market sector (eg. Materials, or
Energy sectors).
- A manual selection of
stocks based on market cap - This can be done using
appropriate stock
selection tools (more notes below).
- Stock liquidity -
You might choose to invest (or trade) only in liquid stocks.
That is, the stocks that have enough turn-over on the market
each day so as to increase your chances of getting into a
position, or exiting one, quickly and without moving the
market. See a discussion
about Stock Liquidity. This topic is also to do with Risk and Money
Management.
If focusing only on the Australian market, then the following
considerations might be useful:
- The so-called "top 200" stocks - the XJO index
(S&P/ASX 200).
- The so-called "top 500" stocks - the XAO index.
- The stocks in the mid-cap 50 index (XMD).
- The stocks in the Small Ordinaries index (S&P/ASX
XSO).
- See more information about the
local market indexes here.
Some considerations to help you decide
When giving some thought to this topic, the following
considerations might help:
- Blue chip stocks:
- Many investors think that they would like to invest in
blue chips stocks. That is a good aspiration.
- However, there is no clear definition of the term blue
chip, and therefore there is no list of blue chip stocks
to work from.
- See the latest definition of the term
blue chip at the ASX website, and note that this
definition wording has changed a couple of times since the
GFC in 2008.
- Any broker or financial advisor that has a list of blue
chip stocks is using their own criteria to compile the
list.
- In truth, at various stages of the economic cycle, blue chips can
disappoint.
- If you are looking for a definitive list of blue chip
stocks, then good luck.
- Large cap stocks:
- These tend to have a market capitalisation in the order
of $10 billion or more (subject to change).
- These are analysed by the research analysts, and
recommended by the brokers.
- There tend to be many buy/hold/sell recommendations for
these stocks
- Of the 2000+ stocks on the Australian market, only a
small number of them are large cap stocks and watched by
the research analysts. The conclusions and recommendations
of the research analysts do influence the opinions and
purchase decisions of many investors. You might choose to
consciously follow the crowd and consider their views, or
you might decide to avoid these stocks.
- The Australian XTL index (S&P/ASX 20) comprises just
20 large cap stocks.
- Small cap stocks:
- These tend to have a market capitalisation in the order
between about $300 million and about $2
billion (subject to change).
- The companies that are considered to be small cap
stocks, tend not to be watched by research analysts, nor
recommended by lots of brokers. You might decide to ignore
these, or to follow these stocks.
- Small cap stocks tend to be less liquid than the larger
cap stocks. So be careful about the stock liquidity.
- Mid-cap stocks:
- These tend to have a market capitalisation in the order
between about $1 billion and $5 billion (subject to
change).
- This category comprises stocks that have a market
capitalisation in between the large cap category and the
small cap category.
- These stocks tend to be less well followed by analysts
and brokers. You might like this idea, or not like it.
- Micro cap stocks:
- These tend to have a market capitalisation in the order
between about $50 million and about $300
million (subject to change).
- Micro cap stocks have an even smaller market
capitalisation than the small cap stocks, and are often
even less liquid than the small cap stocks.
- These stocks tend to have even smaller share price
values, which can be volatile.
- Low share prices ("penny
dreadfuls")
- The share prices of companies (on the Australian market)
can vary from as high as $100+ all the way down to less
than 1 cent (ie. to fractions of a cent). The stocks with
a share price of just a few cents or less are often
referred to as the "penny dreadfuls" of the market. The
penny dreadfuls do not usually include any blue
chip stocks, so some people avoid them.
- It is true to say that share prices above about $10 are
unlikely to double or triple in price, whereas share
prices of less than a dollar or so can double in price.
You might decide to have one strategy that focuses on low
share prices (these stocks can be riskier), as opposed to
focusing on the higher priced shares.
- Fundamental metrics
- Debt to equity ratio - Companies with a debt to equity
ratio of about 50 percent or more are more likely to be
stressed when the economic cycle turns and it is harder to
borrow funds to finance company operations. So choosing
companies with a low debt to equity ratio can mitigate
this risk.
- Liquidity
- The notion of stock
liquidity is important for a couple of reasons.
- Hundreds of stocks on the Australian market have very
low daily trades,
and/or low daily volume
or turn-over.
- Without realising it, many investors eventually exclude
illiquid stocks from their stock universe at some stage
during the daily or weekly search for stocks.
- Many investors and traders will filter their list
of investment candidates to exclude the stocks with a very
low level of liquidity.
- See more
information about stock liquidity.
- Sectors:
- You might have a view that info-tech stocks are likely
to have the best candidates at the current point in time.
So you might choose to focus on the stocks within the
info-tech sector. Likewise, for the healthcare sector, or
one of the other sectors.
- Some investors consider some types of sectors to be "old
world" as opposed to "new world". For instance, the
technology sector stocks are considered to be companies
that are more likely to be more valuable in the long term.
This notion is discussed in Nicholas Darvas's book "How I
Made $2,000,000 in the Stock Market".
- Here is one key point to bear in mind about sectors. The
sector indexes (eg. XIJ, XHJ, etc.) are only comprised of
stocks from the XJO (S&P/ASX 200) index. If you want
to know what other stocks across the market are considered
to be in the same GICS sector, then you will need to look
at a list of stocks grouped by GICS industry group code. See more
about the GICS coding system.
- See
more information about the Australian market
sectors, including downloadable
information sheets.
How do the above market indexes relate to each other? Is any one
of them included within another? See
Robert's Index Composition handout.
Stock selection tools and maintaining a list
So how do you actually go about compiling a useful stock
universe list? Many investors/traders will maintain a list of
their favourite stocks (their stock universe) as one or more
watch lists in their computer software - either with their
online broker, or in their chosen software package. It is quite
alright to have more than one stock universe, depending on your
investing strategy.
You could manage your list of securities in a spreadsheet. Or
consider the range of available tools including:
- Search tools available with your online broker.
- Free web-based search tools at various websites. eg. ASX.com.au
- Tools on your online broker's website.
- Charting and technical analysis software tools - such as BullCharts.
Some more tips
Here are a few tips about how to find stocks in a particular
category like those described above:
- Shares versus ETFs and other OTP products. In the old
days, most people only considered company shares; but these
days there are all ETFs and other products which can be
purchased online, or through a broker. This is worthy of
more research.
 For
stocks of a particular range in market cap, use your
charting software to do a search* (in BullCharts, one of the
140 supplied scans is in the "Fundamental" category, to scan
by Market Cap). For
stocks of a particular range in market cap, use your
charting software to do a search* (in BullCharts, one of the
140 supplied scans is in the "Fundamental" category, to scan
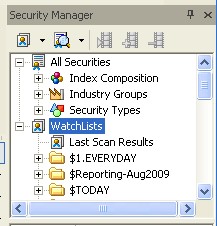
by Market Cap).- For the stocks in a particular sector, view
the "Index Composition" section in Security Manager in
BullCharts*. (See the screen shot at right)
- For the stocks in a particular GICS industry group, view
the "Industry Groups" section in Security Manager in
BullCharts*. (See the screen shot at right)
- To find out the liquidity level of various stocks, firstly
understand more about the issues to do
with liquidity, and then use a tool* to identify
the liquid stocks for inclusion in your universe, or
the illiquid stocks to exclude.
* - The Australian
BullCharts charting software is this author's preferred
tool, and can perform these searches.
More information?
See the links above right for more details.
|


