 |
BullCharts - Getting StartedIntroduction |
 |
Are you new to BullCharts, and trying to get started?
Or perhaps evaluating the software?
Here is a useful list of product features
to help you get started with understanding BullCharts,
including short YouTube videos, and printable PDF Articles.
You are here: Share Market Toolbox >
BullCharts
> Getting Started - Introduction
Related pages: Getting Started #2 - Watchlists, Chart layout, time periods,
Getting Started #3 - Scans (market filters),
Getting Started #4 - Indicators, Templates, Workspaces,
Getting Started #5 - More about indicators and BullScript,
Getting Started #6 - How to use BullCharts,
BullCharts KnowledgeBase, User Group webinar recordings;
Software Features, FAQs, BullChartsUser Groups, TradeSim (for backtesting), Not Convinced?, BullCharts webinar events;
Novice or experienced?
Depending on whether you are a relative novice at charting software and investing/trading in the markets, or relatively experienced, you might want to review this set of "BullCharts - Getting Started" web pages in a different manner:-- Trading/investing novice - It might be best to work through the items on this page below, and follow the "Next Steps" link at the bottom to the second Getting Started page, and so on. This will help to step you through both the things you ought to be thinking about, as well as the relevant features in BullCharts.
- More experienced - If you are more experienced in the markets, then you might want to quickly skim through the headings below, and stop at anything that might grab your attention. Or perhaps jump straight to the "How to Use BullCharts" page towards the end of this sequence.;
Introduction - steps to follow
To walk through the key features of the BullCharts software, and to understand something about them and how to use them, follow the steps below. To quickly find specific infromation on key features, see Robert's BullCharts KnowledgeBase. (Any items below marked "BC-xx-yyy" are some of Robert's eBook pdf Articles in the public area of the Share Market Toolbox.)- What is BullCharts? - It is
Australian-developed charting
software with share market price charts, watchlists, indicators, scans,
and more. You can see more detail here:
- BullCharts - What is it? -
- View the Short Overview video on
.") (2min 5s) -
ref BC-02-050
(2min 5s) -
ref BC-02-050
BullCharts charting software - Briefly tell me what it is.
BullCharts is a complete charting package and includes: - Security Manager with a list of all Australian securities, and indexes, and sector indexes and the stocks within the indexes and sector indexes;
- Watch lists - you can have a couple of watchlists, or many, and you can create "folders" to group together several of your watchlists;
- Chart indicators - eg. Moving Average, MACD, RSI, Bollinger Bands, etc;
- Chart annotations (lines, text, icons, etc.); and
- Scanning tool to search for stocks that meet certain criteria.
- View the Detailed Overview video on (38mins)
Provides more details about: - Security Manager (lists of which stocks are in the indexes, by GICS code, and a list of indexes);
- Watchlists;
- Scans to search for stocks meeting your own criteria;
- Chart indicators; and
- Templates.
- Browse the related 3-page printed PDF Article BC-02-050 - "BullCharts - What
is it?"
- Explore the BullCharts window - watch the video at (5m 30s).
(NOTE: This video is best viewed at "480p" - change the setting before it starts to play.)
This video is a quick look at: - the price chart,
- time periods (daily, weekly, monthly),
- chart type (candles, lines, other),
- indicators and the indicator toolbar,
- templates and the template toolbar, and
- chart annotations (text, lines,
symbols).
 Watch Lists -
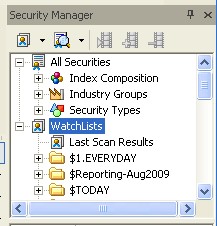
BullCharts already includes lists of the stocks within each index in the Security Manager window panel (see brief screen shot at right). It is very quick and easy to create and maintain your own list of favourite stocks, or your portfolio list (just one, or several).
And viewing the price chart for each stock in your watch list is very quick because the stock data is stored on your computer in a modern-day database:-- View the Watch Lists intro video on
(3 mins) - ref BC-03-020 - View the Watch Lists - Part 2 video on
(3 mins)
- Indicators - BullCharts already includes more than 200 technical analysis chart indicators. See more details on Getting Started #4. (Video coming soon).
- BullCharts Scans - View
the "Introduction to Scans" video on (5m50s).
An introduction to the BullScan Manager - to find stocks that meet your selection criteria.
You specify your selection criteria, and a list of stocks to scan through, then run the scan.
The stocks that meet your selection criteria are listed in the Scan Results table.
Then it is easy to view a price chart and show the scan criteria elements automatically.
- List of BullCharts features - See
a brief summary list of BullCharts features.
- How to install and/or upgrade
BullCharts (Robert's Article BC-01-000).
- A "Table
of Contents" list of all the BullCharts
eBook (PDF) Articles that Robert has
written
(Article BC-00-200).
- BullCharts - Product Overview. (Article BC-02-100)
- BullCharts - A Complete (detailed) product overview. (Article BC-03-020)
- Price Chart basics in BullCharts. (Article BC-03-050)
- The BullCharts Control Panel. (Article BC-04-000)
- Author Strategies - What are they?
- BullCharts includes a number of scans and chart indicators that are
based on the writings or theories of famous text book authors (eg.
Daryl Guppy, Alan Hull, Jim Berg, etc.) (See Article BC-26-050)
 Develop and test your own strategies
- Use the Training Mode (and the Training Mode toolbar) to hide recent
price history on a chart, and to practise interpreting the chart.
Develop and test your own strategies
- Use the Training Mode (and the Training Mode toolbar) to hide recent
price history on a chart, and to practise interpreting the chart.- Back Testing - an introduction to TradeSim. (Article BC-13-000).
The Next Steps?
See Getting Started #2 - Watchlists, Chart layout, Time periods (daily, weekly, monthly).Note: The Articles listed above are all available for free in the Share Market Toolbox. But most of the many other Artilces are only available to Toolbox Members.
Also see:
- The Australian BullCharts User Group webinar meeting recordings.
- Robert's BullCharts KnowledgeBase, which comprises access to:
- Getting Started #2 - Next Steps (watchlists, chart layout, time period).
- Getting Started #3 (indicators, templates, workspaces.
- Robert's BullCharts video Channel for a list of all
videos.
- BullCharts FAQs (Frequently Asked Questions).
- Arrange a Free software Trial?
If you don't yet have BullCharts,
we can arrange a free 2-week trial
of the software.
Contact Robert to arrange this. - User Group information (FAQs, the
Yahoo Forum, etc.).
- Robert's full collection of eBook
(pdf) Articles on BullCharts (and Share Trading and Technical
Analysis).
- Robert's Seminars on the Share Market,
Charting, and BullCharts.
- The official BullCharts web site - www.bullcharts.com.au
- The BullCharts Users' Forum
www.bullcharts.com.au/Forum/
- Robert is a qualified and authorised BullCharts reseller, running the BullCharts User Group, and offering help and support to BullCharts users.