|
Dear
Reader,
Welcome to the 14th edition of my (normally
fortnightly) BullCharts software Tip Sheets, focussing on tips and
hints regarding the Australian BullCharts charting software package.
Sometimes we get carried away with priorities, and some things just
slip a little; but this edition of the BullCharts Tip Sheet contains
some really juicy details about both Bear Markets turning, and Multiple
Moving Average (MMA) indicators.
In the notes below, we copy an existing indicator, and customise it to
create our own. I have already done this. If you want, you can download
my own MMA indicator, and use it without going through the steps below.
A link to do it, plus download instructions, is included below.
Please note that I am re-running a seminar from last year - Technical
Analysis Introduction. It's happening in late June!! More details in
the column at right.
Firstly, a little good
news about some BullCharts hands-on workshops that I have been talking
about for a long, long time.
As I mentioned last time I have sourced a good venue in Vermont South,
just off Burwood Highway, not far from the Vermont South shopping
centre (in Melbourne's eastern suburbs). I will be running a whole
series of share market and technical analysis seminars and BullCharts
workshops at the Vermont South Community House (VSCH) in the school
term 3 from July to September. The VSCH is publishing and distributing
over 4000 copies of their total education program to neighbouring
houses. If you live in that area you will receive their program and see
the event details. I will very soon put the details and dates on my web site here - stay tuned.
I recently delivered my
new and FREE seminar - "The 10 Key Lessons from the
GFC (for investors and traders)" seminar (ie. the
Global Financial Crisis) at The Leighoak Hotel in Oakleigh. There were
free hand-outs for all those who registered. A copy of the 25-page
handout notes is available to download for FREE from this web page.
I am always happy to
receive feedback and suggestions for these Tip Sheets. Or if anything
in a Tip Sheet is not clear, please feel free to contact me to ask
about it (by email or phone). Or maybe I have made a mistake, which I
will be pleased to correct in the next Tip Sheet (along with an
acknowledgement for whoever spots it first).
Please feel free to send me feedback, or
requests for additional topics for these Tip Sheets or the
monthly eNewsletter articles.
Good luck with your trading.
Robert ("Brainy") Brain
(Contact details below.)
Topics in this Tip Sheet edition: |
 |
|
Technical
Analysis Introduction seminar
Bear
Market turning?
Copy an
existing indicator
Modify
the new indicator
Download
Brainy's MMA indicator
More
information
This
TipSheet might look strange?
|
| Bear Market turning? |
|

Over recent weeks I have heard many analysts and
commentators both here in Australia and in the US talking about how a
number of stocks, and market indices, are moving above their 200-day
Moving Average (MA). (But do they use a Simple MA or a Exponential MA?
I don't actually know.)
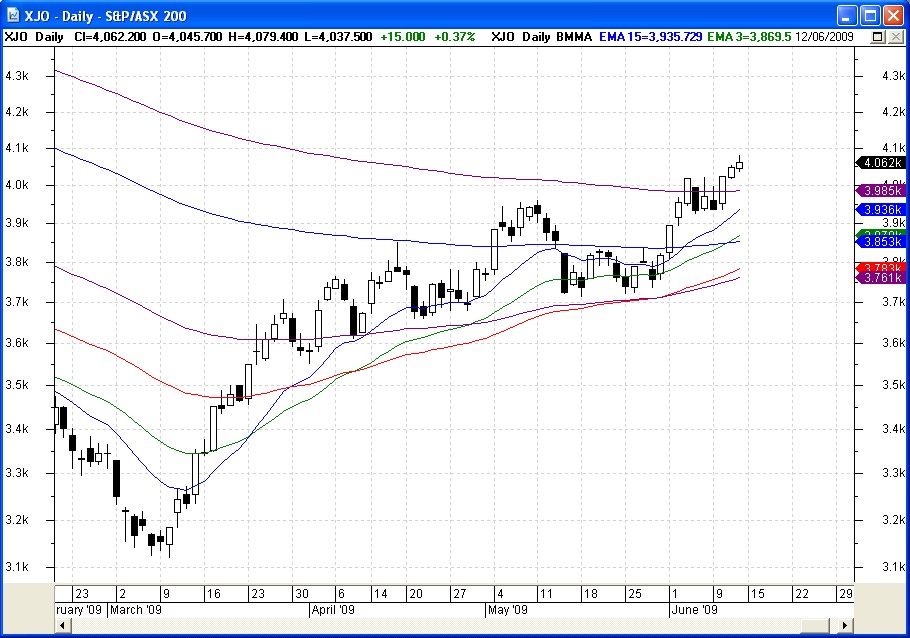
Have a look at the Price Chart shown here of the XJO (S&P/ASX
200) since late February, and showing the last market bottom on 6
March. The highest curve on this chart is a 200-day EMA. (You can click
on the chart to see a larger version.) Notice that the price is now
moving above the 200 day EMA.
It can be possible to get a feel for the bullishness of the market by
looking at share prices compared to their longer-term MA (on price
charts like this one). Some people use this observation (ie. price
above long term MA) as a buy signal. And of course they look for
confirmation from volume, or another indicator or a chart pattern.
But which long term MA should we look at? Above I said that some people
say that 200 days is significant. But other commentators and analysts
suggest different time periods. For example, Stan Weinstein in his book
"Secrets for Profiting in Bull and Bear Markets" talks about a 30-week
MA. He says that we should not buy a stock if the price is below the
30-week MA.
And in the AFR newspaper (Australian Financial Review), they publish
charts using a 60-day MA in the Market Wrap section where they show
charts for five stocks on one page, and several overseas indices on
another page.
And you will find other experts who have a similarly different opinion
about which time period is best to use.
To help us work out which of these might be best for us, we can use a
Multiple Moving Average (MMA) with some key time periods, all on one
chart. It could be useful to view a Daily chart and show a 200-day MA,
and a 150-day MA (which is very close to Weinstein's 30-week MA), plus
maybe a 90 day MA, and a 60 day MA.
If you are happy to have as many as 12 MA curves on your chart, then
you can use the "Guppy Custom MA" in BullCharts, and enter your own
time periods. You can customise it and save your preferred values as
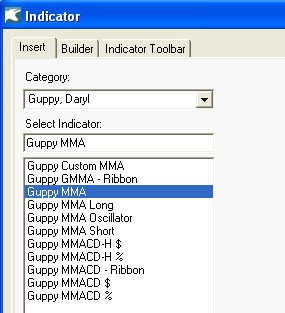
the Default values. To find this indicator in BullCharts, choose
"Insert Indicator" from the menu (or Ctrl+I). In the Indicator dialogue
box, in the "Category" drop-down, scroll all the way down the list
until you find "Guppy, Daryl" toward the bottom (this drop-down groups
the indicators, with authors towards the bottom). Then when Daryl
Guppy's indicators are displayed, choose "Guppy Custom MA". On the
right hand side of this dialogue box you can enter you own values.
However, if you don't want 12 MA curves, you can create your own
indicator, and add it to your Indicator toolbar. This is explained in
the next section.
|
| Copy an existing indicator |
|
|
If you want to create your own
indicator, there are two ways to do it. If you know enough about how to
do it, you can "create a new" one from scratch.
But it is easier to copy an existing one, and then modify it. In the
text below, we will copy an existing one and modify it to suit our own
purpose.
I want to create a variation of the "Guppy MMA" indicator, so we will
copy this one as our starting point.
- In BullCharts, create a new chart
(eg. XJO).
- Click on the menu item "Insert
> Indicator" (or use Ctrl+I).
- In the "Category" drop-down
selection, scroll down to "Guppy, Daryl" towards the bottom of the list
and click once on it.
- In the "Select Indicator" section,
click once on the "Guppy MMA" item in the list. Note that there are no
optional parameters available for customisation on the right hand side.
- Note there are 3 tabs near the top
of this dialogue - Insert, Builder, and Indicator Toolbar. Click once
on the "Builder" tab.
- Click once on the "Copy..." button.
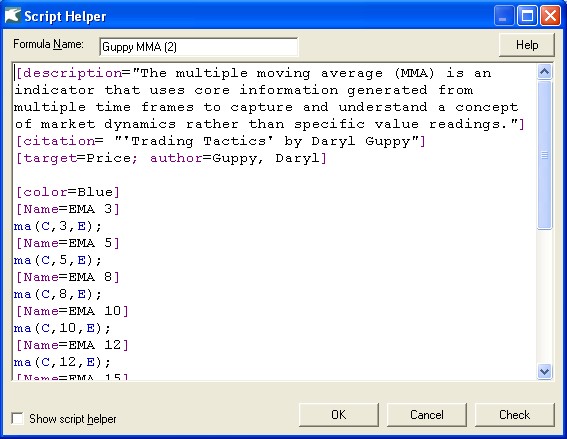
- In the next dialogue box ("Script
Helper" is displayed across the top), click once in the "Formula Name"
field near the top, and replace the text that is there with your own
name - eg. Brainy's MMA. Then click on the OK button. As soon as you do
this, BullCharts will create a new disk file on your computer in the
folder described below, with the name that you typed into the "Formula
Name" box. Note that it appears under the heading of "Guppy, Daryl"
along with his other indicators. The Script Helper dialogue box is
explained a little more in the following section.
To see the list of Custom Indicators on your computer, use Windows
Explorer (or My Computer) and navigate to the following sub-folder:
c:\Program Files\BullSystems\BullCharts\CustomIndicators
|
| Modify the new indicator |
|
|
In the section above we copied an
existing indicator, so now let's Edit this indicator, and customise it
to use our own time periods. Follow these steps.
- In the "Indicator" dialogue box
that shows you a list of the indicators, find the one you just created,
and click on it once to select it, then click on the "Edit..." button.
- In the "Script Helper" dialogue box
(see above) note the first paragraph of text starts out with
"[description]=...". You can change any of the text here to anything
you like.
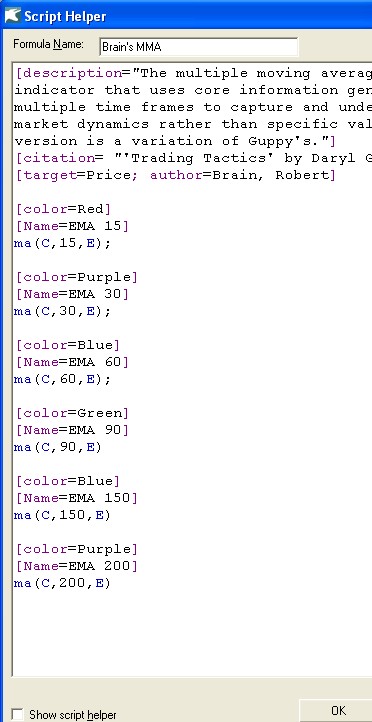
- Notice the text a few lines further
down: "[target=Price; author=Guppy, Daryl]". You can change any of
this. You should replace Guppy's name with your own, so that the
indicator will later appear correctly in the list of indicators.
- Note the next lines of text:-
[color=Blue] [Name=EMA 3] ma(C,3,E); [Name=EMA 5] ma(C,5,E); [Name=EMA
8]... You can change these lines as much as you like. You can delete
some of them. Note the following tips:
- [color=Blue] - This specifies
the colour to be used for the next chart item. There are many valid
colours that you can specify here (about 120). To see a list in
BullCharts hit the F1 key for help, then in the Search field type in
the two words "color attribute" (without the quotes) and hit Enter, and
select Color Attribute from the resulting list.
- [Name=EMA 3] - This specifies
the name of the next chart item. In this case, we have called it "EMA
3". You can change this to "fast", or whatever text you like. Once
again, to learn more, use the BullCharts help topics.
- ma(C,3,E) - This specifies that
a Moving Average is to be plotted on the chart. The letter C of course
is for a MA on the Close prices (you can change this to: O, H, L, etc.)
The 3 is the number of bars. The E indicates the "method" to use -
Exponential, Simple, Weighted, etc. (see the BullCharts help for a list
of possibilities).
- Now that you know the above, you
can change any of the text in the indicator, and click on the "OK"
button when done.
- I have already done a sample
version (called Brainy's MMA) and it is shown below.
|
| Download Brainy's MMA indicator |
|
|
It is easy to download someone else's BullCharts
scan definition file, or custom indicator, and use it on another
computer. This is because each indicator is stored on your computer's
hard drive as a separate and unique file, and the file name is the same
as the name you give to the indicator. You can email the file to
someone, or download from a web site. The steps to download this one
from the web are explained here.
Very briefly what we are doing is this: Copy the indicator file to the
correct folder on your computer, then start BullCharts. It is that
easy. When BullCharts starts, it checks all the custom folders /
directories and notes what files are stored there.
- Firstly, if BullCharts is running, then
shut it down.
- Right-click on the link below, and
select "Save Link As..."
- If you are using Windows XP, then
you need to save this file into the following directory: C:\Program
Files\BullSystems\BullCharts\CustomIndicators\
- Now start BullCharts and it will be
listed with other indicators.
|
| More information |
|
|
More details on some of the topics in these Weekly
Tip Sheets are included in Brainy's Monthly eNewsletters that
are available to subscribers (for a very modest amount). Feel free to
click on the relevant link at right to view samples and more details.
These weekly Tip Sheets for BullCharts* users are intended to be short,
quick grabs of information. They are not a replacement for the monthly
detailed Brainy's eNewsletter articles, which cover these same topics
but in much more detail. The eNewsletters articles also cover Technical
Analysis and Share Trading topics.
Also see the BullCharts on-line help (in BullCharts, hit the F1 key),
and the relevant User Guide Chapter for more details (this is supplied
with the software and copied to your hard drive as a PDF file).
Note: Any screen shots shown in this newsletter are snapped from
BullCharts version 3.8.
FEEDBACK? - I am very keen to receive feedback about these weekly
BullCharts Tipsheets. Please feel free to email me with comments, or
suggestions. Contact details are included below.
* - BullCharts is: "...an
innovative charting and technical analysis system. It provides a
feature rich and powerful set of tools with access to the latest
strategies from local and overseas authors in analysing the dynamics of
the stock market."
|
| This TipSheet might look strange? |
|
|
This TipSheet has been composed in
HTML and distributed using an online service, and is intended to be
viewed in HTML (ie. web language) format. Some parts might look a
little strange, especially if you are viewing a basically text-only
version. I am working on a text-only version.
We have also found that some web-mail clients (eg. Hotmail and Yahoo
mail) can mess up some aspects.
Please feel free to send me feedback
if anything looks strange.
Good luck with your trading.
Robert ("Brainy") Brain
|
|
|
Technical
Analysis Introduction seminar
|
|
|
|
Here's a quick quiz for you.
Technical Analysis is a very broad subject. How much do you know about
each of the following topics? A basic understanding? or a more detailed
knowledge?
- Dow Theory and Efficient Market
Hypothesis
- Trend lines
- Support and Resistance
- Volume
- Price charts
- Chart patterns
- Price breakouts
- Indicators (lots)
- Fibonacci
- Trading intro
- Stop Loss
At the 4-hour Technical Analysis Introduction
seminar I am running in late June, I will give you a really good broad
understanding of what Technical Analysis is all about.
The above list is just a short version of the seminar topics that we
cover. Complete with hand-out notes with all the detail.
More information including details on how to register are on my
web site here.
You can register at my secure outsourced OnLine Shop with credit card
or PayPal, or print the registration form and send it in the mail (but
if sending by mail, please ring me first to reserve a seat).
The seminar venue on this occasion is the Leighoak Hotel in Oakleigh.
|
|