|
Dear
Reader,
Welcome to the 16th edition of my (normally
fortnightly) BullCharts software Tip Sheets, focussing on tips and
hints for BullCharts (the Australian charting
software package).
I have to say that I can't believe how
quickly the time flies in between writing
these Tip Sheets. The big news this week that
has kept me busy for a while is that I have
managed to upload all of the BullCharts
eNewsletter articles to my externally hosted
and secure OnLine Shop.
"What are these eNewsletter articles all
about?" I can hear some people say. Well,
they are in some ways similar to these free
Tip Sheets, except they cover more detail,
with better explanations and more screen
shots and diagrams. And they have their own
index numbering method so you can print them
and file them away for easy reference,
complete with their own frequently updated
Table of Contents.
Now that all the past BullCharts articles are
online in the shop, you can browse the list
of articles, and download the first page of
any of them (or all of them) as the first
page is available at no charge (ie. for
free!). More details in the column at right.
Now, being early August
we are getting into
the Australian company reporting season.
Surely there is some way to leverage off the
reporting season and the news that is
announced! Some of this news will cause
share prices to fall, whilst some news will
cause prices to rise. If only we can be on
top of this and take advantage of it.
In this BullCharts Tip Sheet below I present
some BullCharts tips describing how we really
can take advantage of the reporting season
using specific features in the BullCharts
software.
I also want to point out
that I will be
re-running my Hands-on Trading Workshop
(CFDs, early evening, FTSE, strategy, one
indicator, great experience) very soon -
Friday evening 21 August at VSCH. The last
couple of these workshops have been very well
received. We are limited to only 8 people,
and more details are on my web site: www.robertbrain.com.
And one week after the Trading Workshop I
will be running another of my Technical
Analysis Intro seminars - Saturday afternoon
29 August at VSCH. The last couple of these
seminars have been very well received. More
details are on my web site: www.robertbrain.com.
For both of these events, please contact the
Vermont South Community House (VSCH) to make
a booking.
And, talking about my
web site, you might
have noticed that I recently did a radical
make-over of the web site and the home page.
I have renamed the whole site "Brainy's Share
Market Toolbox" because it is building up to
be a real toolbox full of useful tools to
help you tackle the share market. Perhaps I
should refer to the contents as an arsenal of
weapons for tackling the market?
I am always happy to
receive feedback and
suggestions for these Tip Sheets (and my
Toolbox web site). Or if anything in a Tip
Sheet is not clear, please feel free to
contact me to ask about it (by email or
phone). Or maybe I have made a mistake,
which I will be pleased to correct in the
next Tip Sheet along with an acknowledgement
for whoever spots it first.
Please feel free to
send me feedback, or requests for additional
topics for these Tip Sheets or the
monthly eNewsletter articles.
Good luck with your trading.
Robert ("Brainy") Brain
(Contact details below.)
Topics in this Tip Sheet edition: |
 |
|
Useful
BullCharts information articles
Reporting
Season Trading strategy?
Reporting
Season details
Who
reports on what dates?
BullCharts
watchlists
Use
the Chart Memo option
More
information
This
TipSheet might look strange?
|
| Reporting Season Trading strategy? |
|
|
FACT - During our bi-annual company
reporting
season, some of our companies deliver a
favourable financial report, resulting in a
subsequent increase in share price. In some
cases, the spur in share price can flow on
for a few days, or perhaps weeks, or even
longer. Mind you, if the company report is
positive, but it is below the analysts'
consensus expectations then the share price
can actually fall.
The converse also applies. Some reports can
trigger a lasting fall in share price. Traders can take advantage of
this by short
selling the stock (or short selling a
derivative of the stock like share CFDs).
And, for many companies we know when each
company intends to deliver their report. This
information is readily available.
So, armed with all this information, we can
use BullCharts to set up one or more
watchlists of the stocks to watch in certain
weeks, or on certain days. It is then easy to
visit our watchlist each evening, or each
weekend, and quickly view the price charts of
the companies that have just reported.
It is also easy to peruse the results and
relevant presentations, and we might then be
able to make an investment decision based on
our trading strategy. Use the BullCharts
Quick News Search option to peruse a list of
announcements, news and presentations.
|
| Reporting Season details |
|
|
Okay, reporting season - what is it?
Remember that in Australia we have two
reporting seasons each year - one in
February, and one in August. In these two
months, most of our listed companies have to
lodge their financial results for the
previous 6 month period to the end of
December and end of June respectively. This
is a listing requirement according to the
listing rules administered by the Australian
Securities Exchange (ASX). If they do not
lodge them by the end of the required month,
then trading in their shares is suspended
without question.
The only companies to which this does not
apply are those few that have a different
period-end date (ie. not December/June). The
listing rule still applies to these other
companies, but they will report at different
times with different deadline dates.
When our companies lodge their financial
results with the ASX, many of them make a big
deal of it and have a formal briefing or news
conference to also announce relevant
information. This is often in the form of a
PowerPoint-style of presentation, saved in
PDF format. All of these materials are
readily available from the ASX web site, and
in many cases the larger companies will also
make them available from the "Investor"
section of their own web site.
And in our BullCharts software, these same
news releases and presentations are also
readily available at the click of a button. To view the list of
documents, simply view a
price chart for a selected stock, then click
on the "Quick News Search" button on the
toolbar, or choose Actions - News - Quick
News Search from the menu.
|
| Who reports on what dates? |
|
|
A list of the companies that intend to report
on certain dates is readily available from a
number of sources (actually not very many -
this is hard to find). Mind you, companies
are not obliged to announce the date on which
they will report, and they are entitled to
announce a date and then change it. So any
list of company reporting dates tends to be
compiled by interested parties for the
information of their own clients.
One of these is the Board
Room Radio web site -
www.brr.com.au. Another at www.incomeinvestor.com.au.
(You will need to enter any old email
address to gain access - no problem). And another at www.egoli.com.au/researchtools.asp.
Or you can check in the AFR newspaper each
Monday for the week ahead (on page 3).
Many brokers also provide this information
for the use of their own clients. Your
broker might publish a list. Try asking them
for a copy.
|
| BullCharts watchlists |
|
|
Now that you know when the companies are
reporting, you can build a simple BullCharts
watchlist.
Because I like to watch a number of
companies, I have created a Watchlist Folder,
and within that I have created several
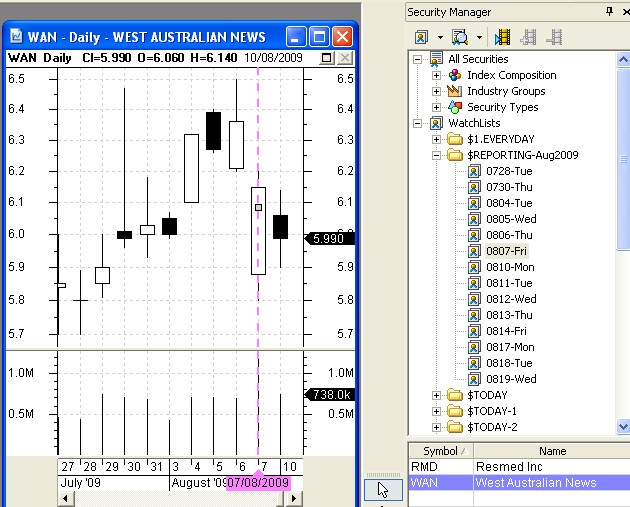
Watchlists - one for each reporting day. Refer to the accompanying
screen shot to see
what I have. (Click on the image for a
larger version.)
Notice the following in the sample:
- WAN price chart - The left-hand portion
of the screen shot is a simple price chart of
WAN, which was due to report results on
Friday 7 August. On the price chart I had
previously marked this date with a feint
vertical dotted line so that the next time I
viewed the price chart for WAN, this vertical
line will indicate the intended reporting
date. Note that I have IntelliCharts turned
on so that BullCharts remembers these lines
when I plonk them on the chart. Another TIP:
I changed "My Defaults" for the Vertical Line
tool in BullCharts, so that I could easily
work down a list of stocks and plonk the line
on the right date with the line parameters
already set to: dashed line, feint colour. It
is easy to change "My Defaults" for each of
the tools. Then I won't get these vertical
lines mixed up with any other vertical
lines.
- Security Manager - The right hand
half of
the screen shot is my Security Manager.
- In the Security Manager, under the
"Watchlists" heading, I have created a
Watchlist Folder and called it
"$REPORTING-Aug2009". The dollar sign forces
the item towards the top of the list. If you
don't have many watchlists then this is not
an issue. But if you have many, then this
TIP can be useful. And I included the
reporting month in the name to keep it
separate from the reporting last February,
and for next February. It will also make it
easier to delete the whole list of watchlists
one day when I am done.
- Inside this Watchlist Folder I have
created one Watchlist for each reporting
date, and I have used the following format to
force them to appear in chronological order:-
MMDD (for month and date), then a hyphen for
readability, and the day of the week (because
it is useful).
- The watchlist that is "selected" in
the
screen shot is "0807-Fri". That is, August
7th.
- And the list of stocks in this
watchlist
are shown towards the bottom - just two: RMD
and WAN.
- Now look at the price chart, and
notice
the big white candle on the reporting day,
even though the Open price on the candle was
about 50c below the previous day's Close. Now we can watch this stock
for the next few
days, and use our favourite indicators to
determine if it is a buy or not.
|
| Use the Chart Memo option |
|
|
The new Chart Memo feature is
included in
BullCharts from version 3.8 onwards. To
display the Memo panel, use the menu option:
View - Show Chart Memo, or just hit Ctrl+W.
Within the Memo, you could make your own
notes about the reporting date, and any
observations or intentions that you might
have about the stock. This might include any
broker or analyst comments about expectations
from the newspaper or from your broker or
subscribed news feeds or email newsletters.
Of course, you can also drop Text boxes onto
the chart (and either "Anchor to date" or
not, as required).
|
| More information |
|
|
More details on some of the topics in these
Weekly Tip Sheets are included in Brainy's
Monthly
eNewsletters that are available to subscribers (for a very
modest amount). Feel free to click on
the relevant link at right to view samples and more details.
These weekly Tip Sheets for BullCharts* users
are intended to be short, quick grabs of
information. They are not a replacement for the monthly
detailed Brainy's eNewsletter articles, which cover these same topics
but in much more detail. The eNewsletters articles also cover Technical
Analysis and Share Trading topics.
Also see the BullCharts on-line help (in
BullCharts, hit the F1 key), and the relevant User Guide
Chapter for more details (this is supplied with the
software and copied to your hard drive as a PDF file).
Note: Any screen shots shown in this
newsletter are snapped from BullCharts version 3.8.2.
FEEDBACK? - I am very keen to receive feedback about these weekly
BullCharts Tipsheets.
Please feel free to email me with comments, or
suggestions. Contact details are included
below.
* - BullCharts
is: "...an innovative charting and
technical analysis system. It provides a feature rich and
powerful set of tools with access to the latest strategies
from local and overseas authors in analysing the
dynamics of the stock market."
|
| This TipSheet might look strange? |
|
|
This TipSheet has been composed in HTML and
distributed using an online service, and is
intended to be viewed in HTML (ie. web language) format. Some parts
might look a little strange, especially
if you are viewing a basically text-only version. I am
working on a text-only version.
We have also found that some web-mail clients
(eg. Hotmail and Yahoo mail) can mess up some aspects.
Please feel free to send me feedback if
anything looks strange.
Good luck with your trading.
Robert ("Brainy") Brain
|
|
|
Useful
BullCharts information articles
|
|
|
|
As you might know, I have been writing a
series of BullCharts articles of about
4-pages each since last October. So I now
have quite a collection of them (16 articles
covering 63 printed pages).
As of last week I now have all these
BullCharts eNewsletter articles available
individually on my secure online shop. They
include some serious BullCharts tips, and
"how-to" descriptions of many of the key
features in BullCharts. The list of topics
is too long to include here, and it is
growing each month as I write another couple
of articles.
Feel free to browse the
list of articles here.
The first page of each article is available
to download for free, to give you an overview
of the content in the article. And some of
the articles themselves are available for
free (the single-page sheets, and the
Contents and Overview sections - I have to
give some things away for free).
These BullCharts articles are the ones that I
write each month for subscribers, along with
articles on Share Trading and Technical
Analysis. The back issues of the Share
Trading and Technical Analysis articles are
not yet up in the OnLine Shop, but they will
be there very soon - I will let you know when
it is done.
If you have any questions about these, please
feel free to email or phone me (or catchup at
a BullCharts User Group meeting, or an ATAA
meeting).
|
|