|
Dear Reader,
Welcome to the 9th edition of my BullCharts
software Tip Sheets, focussing on tips and hints relating to the use of
the Australian BullCharts charting software package.
The last Tip Sheet (number 8) was delayed a few days because of a
glitch with the provider I use. This took a few days to work through;
but is now resolved.
I started out writing these Tip Sheets on a weekly basis, but from some
feedback it seems that weekly is a little too often, so I am now doing
them on a fortnightly basis. I am happy to receive feedback on this, or
any suggestions relating to these Tip Sheets.
In this Tip Sheet edition I explain a couple of things that are both to
do with how to "rearrange" the tabs across the bottom of the BullCharts
window. A bit hard to explain briefly, so please see below for details.
Also, the latest edition of my monthly e-Newsletter articles includes
details about the very handy BullCharts IntelliCharts feature, and the
ins and outs of the price charts. There is also a discussion on
position sizing, and an Excel spreadsheet Position Size Calculator. If
you have not seen my monthly e-Newsletter articles, you can see a
preview (the first page of each of the four 4-page articles). Click here for more details about
Brainy's Monthly eNewsletter articles (on Technical Analysis, Share
Trading and BullCharts).
Please feel free to send me feedback, or
requests for additional topics .
Good luck with your trading.
Robert ("Brainy") Brain
(Contact details below.)
Topics in this week's Tip Sheet: |
 |
|
Correlation
Workshop (done)
BullCharts
Price Charts - handling window "panes"
Stacked
indicators - Moving Panes
Multiple
price panes - moving them around
More
information
This
TipSheet might look strange?
|
| BullCharts Price Charts - handling window "panes" |
|
|
There are two situations in BullCharts where
you might have multiple window "panes" open, and you might want to move
them around.
The first situation is with Stacked Indicators
within just one price chart. In Brainy's Tip Sheet #3 I talked about
the F3 function key to "stack" indicators within the Price Chart pane,
resulting in tabs across the bottom of the screen. You might want to
change the sequence of these tabs across the screen. This is explained
below.
The second situation is where you might have multiple price charts
displayed in the BullCharts window. This might be in a "Workspace"
(more on workspaces in a future Tip Sheet). You might want to
re-sequence the tabs across the bottom of the window. This is also
explained below.
|
| Stacked indicators - Moving Panes |
|
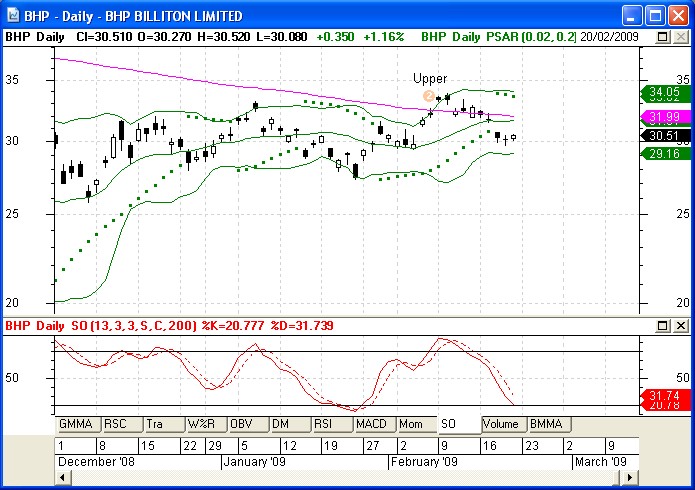
Let's say you have one price chart displayed
like the one shown here of BHP. You might have several indicators
showing with this chart, and by "Stacking" the indicators (using the F3
function key) you can display one of the indicators in the bottom pane
(or the top pane if you have different settings), and the other
indicators are hidden behind this indicator pane - that is, they are
all "stacked" one behind the other.
In this situation, you can click on one of the tabs to display the
relevant indicator. In the sample shown here, the tabs and indicators
are: GMMA (Guppy's Multiple Moving Average), RSC (Relative Strength
Comparison), Tra (number of Trades), W%R (Williams %R), OBV (On Balance
Volume), DM (Directional Movement and ADX), RSI (Relative Strength
Index), MACD, Mom (Momentum), SO (Stochastic), Volume, and BMMA
(Brainy's own Multiple Moving Average indicator).
If you are not happy with the sequence of these tabs across the screen,
you can right-click on one of them, and choose "Move pane..." from the
drop-down menu. Another dialogue box will open showing a list of the
indicator panes, and you can select any one of the listed panes, and
click on the "Move Up" or "Move Down" button to change it's sequence in
the list. Then click on Apply, or OK to save the changes.
BTW:- What is the difference between Apply and OK? Clicking on Apply
will apply the changes and leave the dialogue box open. Clicking on OK
will apply the changes, and close the dialogue box. What's the use of
this? Well you might want to "apply" the changes, then have a look at
the end result, and maybe apply some more changes.
|
| Multiple price panes - moving them around |
|
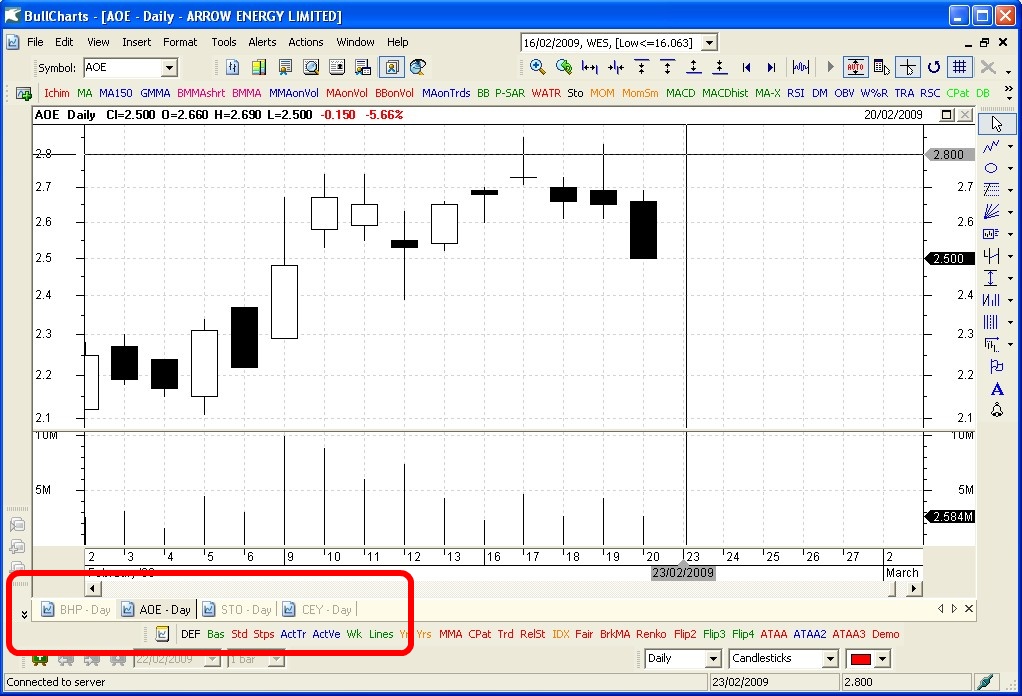
In this scenario you might have several price
charts open. This might be a Workspace, or maybe you have just opened
several new price charts. The result might be like in the accompanying
screen shot. This sample has four price charts, shown in a "maximised"
BullCharts window. That is, one price chart takes the entire BullCharts
window, and the other 3 price charts are hidden behind but you can see
a tab for each (highlighted with the red coloured rectangle encircling
the four tabs near the bottom of the window).
In this situation, you might want to change the sequence of the four
tabs across the screen. That is, you might want to put them into
alphabetical order, or group them together by industry type, or perhaps
put index charts at the left end and price charts at the right end. Or
you might want to have daily charts at the left end, and intraday
charts at the right end (if you have access to intraday / live data).
To do this, you can simply mouse-click on a tab and drag it to another
location across the screen (ie. click and hold the left mouse button,
and "drag" it).
Or, you can right-click on a tab, to see a drop-down menu of several
choices that include:
- Close (tab)
- Rename Tab
- Sort Alphabetically
- Arrange Tabs...
If you choose "Arrange Tabs..." a small dialogue
box opens up where you can click on a tab name, and use the "up" or
"down" arrow to change the sequence, or click on the "Sort" button to
sort alphabetically.
|
| More information |
|
|
More details on some of the topics in these
Weekly Tip Sheets are included in Brainy's Monthly eNewsletters that
are available to subscribers (for a very modest amount). Feel free to
click on the relevant link at right to view samples and more details.
These weekly Tip Sheets for BullCharts* users are intended to be short,
quick grabs of information. They are not a replacement for the monthly
detailed Brainy's eNewsletter articles, which cover these same topics
but in much more detail. The eNewsletters articles also cover Technical
Analysis and Share Trading topics.
Also see the BullCharts on-line help (in BullCharts, hit the F1 key),
and the relevant User Guide Chapter for more details (this is supplied
with the software and copied to your hard drive as a PDF file).
Note: Any screen shots shown in this newsletter are snapped from
BullCharts version 3.8.
FEEDBACK? - I am very keen to receive feedback about these weekly
BullCharts Tipsheets. Please feel free to email me with comments, or
suggestions. Contact details are included below.
* - BullCharts is: "...an
innovative charting and technical analysis system. It provides a
feature rich and powerful set of tools with access to the latest
strategies from local and overseas authors in analysing the dynamics of
the stock market."
|
| This TipSheet might look strange? |
|
|
This TipSheet has been composed in HTML and
distributed using an online service, and is intended to be viewed in
HTML (ie. web language) format. Some parts might look a little strange,
especially if you are viewing a basically text-only version. I am
working on a text-only version.
We have also found that some web-mail clients (eg. Hotmail and Yahoo
mail) can mess up some aspects.
Please feel free to send me feedback
if anything looks strange.
Good luck with your trading.
Robert ("Brainy") Brain
|
|
|
Correlation Workshop (done)
|
|
Have you ever wondered about the
"correlation" of various stocks to each other? or of currencies to each
other? or one market to another? or two indices to each other? Or
perhaps just the correlation of a share price to it's index?
Exactly what is "correlation"? Basically it's the study of how well two
entities either track each other over time, or not track each other.
And how can you use this knowledge to advantage to reduce your trading
risk?
TCT Australia is a company I work with in supporting traders and
investors, and they ran a 2-hour workshop in Melbourne early March (on
a Wednesday evening) on the topic of Correlation.
More than 60 people attended this very worthwhile workshop. If you
weren't there, then unfortunately you missed out. Stay tuned for
information about other useful evening workshops that TCT will be
running in the near future.
Or you can register to receive free Trading Videos and the TCT
Newsletters, and find out first hand about future workshops. See the
TCT web site link below for details.
TCT Australia specialises in providing training and mentoring to
traders. Their best selling product is the Live Trader Program, which
includes some theoretical online video training, and 5 days of hands-on
realistic and mentored trading practise in their trading room (using a
practise trading account with $100,000 of play money).
Feel free to contact me for further details about this program.
|
|