|
Dear
Reader,
Thank you for your patience as I spend a few
extra days setting up my weekly BullCharts* TipSheet newsletter service
(using the external provider), and I try to get the layout and content
right for the first one. (But I am not yet convinced that the text-only
version is correct.)
| Topics in this week's newsletter: |
 |
|
Line
studies toolbar - the Crosshair toolbar button
BullCharts
Templates
To Apply
a Template
Template
"Preferences"
Template
files and Toolbar
More
information
This
TipSheet might look strange?
|
| BullCharts Templates |
|
|
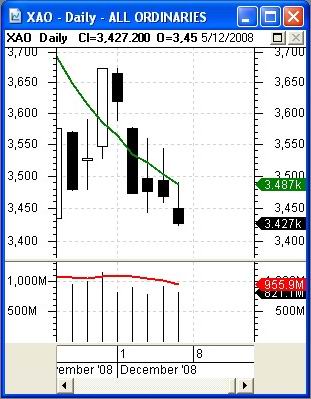
A BullCharts "template" is basically a
single price chart, including any number of indicators, and with
specific colours and timeframe.
Eg. the sample shown here is a Daily chart and has a Moving Average on
the price plot shown in green, and a Moving Average on the Volume pane
shown in red. And, these moving average lines are thicker than normal.
This chart could also have had a number of indicator panes.
You can save a "template" like this sample, and then apply it later to
a new price chart.
You can also take whatever the current on-screen price chart looks
like, and save it as the "Default Template" to be applied automatically
every time you create a new price chart. Right click the mouse anywhere
over a blank part of the price chart and choose "Set as Default
Template".
|
| To Apply a Template |
|
|
There are a couple of ways to "apply a template" to
your displayed price chart:
- On the menu: Format > Apply
Template
- Use the Ctrl + t keys.
- The Template Toolbar
|
| Template "Preferences" |
|
|
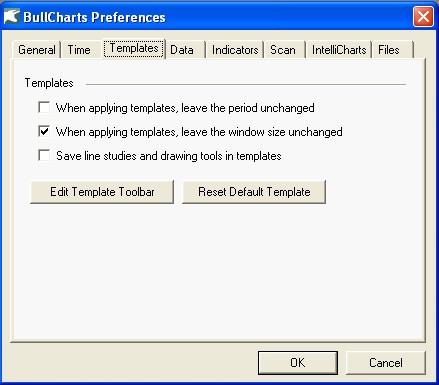
There are some options to define the
behaviour of the templates when applied. Refer to the menu option:
Tools > Preferences > Templates tab.
Note here that "Edit Template Toolbar" is one option.
|
| Template files and Toolbar |
|
|
For an explanation of where the
template files are stored, and how to manage them, see a future weekly
newsletter. Likewise, for an explanation of the Template Toolbar and
how to add and rearrange toolbar buttons, see a future newsletter.
|
| More information |
|
|
These weekly newsletters for
BullCharts* users are intended to be short, quick grabs of information.
They are not a replacement for the monthly detailed eNewsletter that I
publish, which might cover these same topics but in much more detail.
The eNewsletters also cover Technical Analysis and Share Trading
topics.
Also see the BullCharts on-line help (in BullCharts, hit the F1 key),
and the User Guide Chapter 9 (this is supplied with the software and
copied to your hard drive as a PDF file).
Note: Any screen shots shown in this newsletter are snapped from
BullCharts version 3.8 (which will be available very soon).
FEEDBACK? - I am very keen to receive feedback about these weekly
BullCharts Tipsheets. Please feel free to email me with comments, or
suggestions.
* - BullCharts
is: "...an innovative charting and technical analysis system.
It provides a feature rich and powerful set of tools with access to the
latest strategies from local and overseas authors in analyzing the
dynamics of the stock market."
|
| This TipSheet might look strange? |
|
|
This TipSheet has been composed in
HTML and distributed using an online service, and is intended to be
viewed in HTML (ie. web language) format. Some parts might look a
little strange, especially if you are viewing a basically text-only
version. I am working on a text-only version.
We have also found that some web-mail clients (eg. Hotmail and Yahoo
mail) can mess up some aspects.
Please feel free to send me feedback if anything looks strange.
|
|
|
Line studies toolbar - the Crosshair toolbar button
|
|
|
|
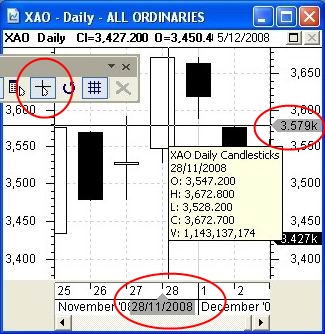
On the BullCharts* Line Studies
toolbar there is a button to toggle the cursor "crosshair" on and off
(indicated with a red circle near the top left of the screen shot
above).
In this screen shot, the crosshair is turned on and it is represented
by the two fine lines that cross on the big white candle on 28 Nov.
Accompanying the crosshair is the tag on the vertical price scale
(shown here on the right as "3.579k"), and the tag on the horizontal
time scale (shown here as "28/11/2008") - both of these are highlighted
here with a red ellipse.
As you move the cursor around the screen these values are dynamically
updated to indicate the cursor position on the screen.
How is this useful? - The vertical line runs all the way down the
screen, through the price plot, and into the Volume pane, and across
any separate indicator panes that might be visible above and below the
price pane. So you can line up a feature or pattern across all the
panes. Or across the chart, you can easily line up key features like
price highs or lows, or support/resistance patterns, etc.
As normal, when you hover the mouse cursor over a candle, an
information box is displayed with the properties of the candle
displayed (as in the figure above).
|
|