|
Dear Reader,
Welcome to the 20th edition of my BullCharts
software Tip Sheets, focussing on tips and hints
for BullCharts (the Australian charting
software package).
I am sending this one to both the BullCharts
users and my Toolbox Members for interest.
The BullCharts scanning feature (often just
called BullScan) is both feature-rich, and
simple to use. Many people can utilise it
fairly easily; but it can take a while to
understand all of it's useful features.
So in this Tip Sheet I cover off some useful
aspects of BullScan, and answer the question:
"I have done a scan, and I can see the
Scan Results Table, complete with a few
columns of information, but how can I save
that table for use later?"
More specifically we look at the following items:
- The columns in the Scan Results Table -
how can I include more details?
- How can I save the Scan Results Table as
a Watchlist?
To do all this, I will use a realistic Case
Study sample scenario.
Don't forget to visit the BullCharts section of my
Share Market Toolbox web site for more useful
information about
BullCharts (my Toolbox is an arsenal of
weapons to help you
tackle the share market).
And the Tip Sheet Archive Section
and the
Index page for information
about past Tip Sheets.
I am always happy to receive feedback and
suggestions for these Tip Sheets (and my
Toolbox web site). Or if anything in a Tip
Sheet is not clear, please feel free to
contact me to ask about it (by email or
phone). Or maybe I have made a mistake,
which I will be pleased to correct in the
next Tip Sheet along with an acknowledgement
for whoever spots it first.
Please feel free to
send me feedback, or requests for additional
topics for these Tip Sheets or the
monthly eNewsletter articles.
Good luck with your trading.
Robert Brain (aka Brainy)
(Contact details below.)
| BullCharts Tuition and Mentoring |
 |
|
Don't forget that help with BullCharts is
available for you. You can participate in the
Australian BullCharts User
Group for free - even if you don't live
in Melbourne. And you can have free access to
the
Yahoo Forum with
miscellaneous useful files and messages. The
group meets monthly in Oakleigh. More details
are on the web here.
And Robert is available to help you as well -
in the form of one-on-one tuition, either in
person (at your place), or over the internet.
The fees are very reasonable. More details are on this web page.
|
| BullCharts Scan - CASE STUDY sample |
|
|
In this case study example, I want to see a
list of my favourite stocks at lunchtime, and
sort them by percentage change today.
To do this I will take a market Snapshot at
lunchtime. And I want to run a BullCharts
scan over my favourite watchlist to calculate
the percentage change in share price since
yesterday's close. And I want to sort the
resulting list of stocks in order of
percentage change with the largest change at
the top, and the smallest at the bottom.
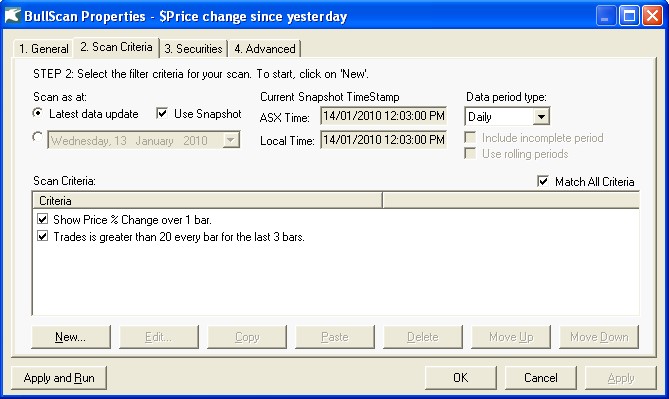
To do this we can create a new scan and
include the following two scan criteria on
the "2. Scan Criteria" tab (as in the screen
shot above - click on it for a larger image):
- Show the Price % Change
over 1 bar.
- Number of Trades is greater
than 20 every bar in the last 3 bars - to
weed out the thinly traded (illiquid)
stocks.
The resulting Scan Criteria dialogue box can
look like the accompanying screen shot. Also
note the following in this scan:
- The option Price % Change
is available under the scan Category
drop-down selection for "Is a price or chart
field".
- For any of the items you select in the
top of the Scan Criteria box, it is possible
to just "Show this value" in the Results
Table.
- The "Use Snapshot" check box is ticked,
to use the Snapshot data instead of "today's
close" prices.
Of course, on the "1. General" tab, it is
useful to enter meaningful details for the
following items because these will group your
scans together to make them easier to find later:
- Scan Name - in this example I called this
scan "$Price change since yesterday". [TIP -
Using the $ symbol at the start of the name
will force this scan to appear at the top of
the list of scans that are sorted into
alphabetical sequence. This is because the
dollar symbol gets sorted before all
alphanumeric characters.]
- Category
- Author
Also note that the tab "4. Advanced" includes
the following items:
- "Sorting - Initially Sort by:";
- Ascending or Descending;
- plus some other options.
|
| BullScan - the Scan Results Table |
|
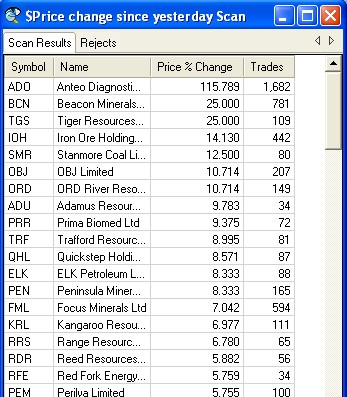
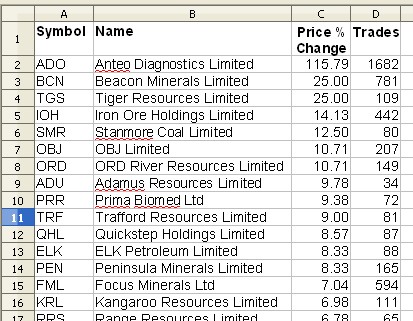
When I ran this scan at about midday today
(14 January), across the stock list "All
Securities", I ended up with a Scan Results
Table as in the accompanying screen shot
(click on it for a larger image), containing
some 408 securities. Notice the very top
title bar of this table contains the name of
the scan - in this case "$Price change since
yesterday".
If you want to include more columns in this
table, it is a simple matter to just add them
as extra Criteria in the Scan Definition. You
can simply select "Show this value".
Don't forget that every time you run a scan,
there is a watchlist saved automatically - it
is called "Last Scan Results". You can rename
this watchlist to anything else you like. And
you can move it into a Watchlist folder.
The next time you run a scan, the existing
"Last Scan Results" watchlist will be
replaced with the results of the latest scan.
But, this watchlist is only a list of the
securities. It does not include any of the
numbers that were displayed in the Scan
Results Table. As far as I know, there is no
way to reproduce the scan results table
without running the scan again. And if you
run the scan on a different day (or using a
different snapshot), then the results will
potentially be rather different.
|
| Saving the Scan Results Table details |
|
|
Now let's say you want to save the data from
the Scan Results Table for some reason. There
are two ways to do this: either (a) "Export"
the data to a CSV file; or (b) "copy and
paste" the data into a spreadsheet (or a text
document).
The "Export" option is available as a
drop-down menu option when you right-click
some where on the Scan Results Table, or from
the File menu options. A "CSV" file is a
"Comma Separated Value" file. That is, it is
a plain text file that can be easily imported
into a spreadsheet program like Open Office
Calc (or Microsoft Excel) [Have you noticed
that I prefer Open Office, because it is
cheaper than Microsoft Office, and it is better.]
How can we "Export" just a few lines of the
Table and not all of them? See the comments
in the next section below about "selecting"
specific stocks in the list.
So, how can we save the data into a
spreadsheet? (ie. option number (b) above.)
Follow these steps:
- Click once some where on the Scan Results
Table to make sure it is the "active" window
pane.
- You now need to "select all" in this
window. You can use the Ctrl key and the
letter A, or the BullCharts menu option: Edit
- Select All.
- Now, copy all of the selected data into
the Windows Clipboard as follows: Either use
the Ctrl key and the letter C, or the
BullCharts menu option: Edit - Copy.
- Now open up your spreadsheet program (or
whatever). In my case, I use Open Office Calc
(not Microsoft Excel).
- In your spreadsheet program, with a new
spreadsheet open, simply "paste" the
Clipboard contents - either with the Ctrl key
and the letter V, or use the menu option:
Edit - Paste.
And there you have it. The Scan Results Table
is now in your spreadsheet program for you to
save, and do other things with.
|
| Saving the stock list as a Watchlist |
|
|
If you want to save the list of stocks from
your scan, you can rely on the "Last Scan
Results" watchlist mentioned above, or there
are a couple of other options:
- Right-click some where on the Scan
Results Table, and from the drop-down menu
choose: "Create as Watchlist". This will
create a new watchlist with the same name as
your Scan. In this case "$Price change since
yesterday". And it will contain ALL the
stocks in the results table.
- If your results table has a number of
stocks, and you want to create a watchlist
containing just some of the stocks, then just
"select" the required stocks, and right-click
and choose "Create as Watchlist". To "select"
the required stocks, there are two options as
in many Windows programs: (a) For a
consecutive group of stocks, click once on
the first one in the group, then hold down
one Shift key on the keyboard and then click
once on the last stock in the list; or (b)
click once on the first desired stock, then
hold down the Ctrl key, and while holding the
Ctrl key down, just click on each desired
stock to build up a number of "selected"
stocks. This applies to the "Export" option
as well.
- Don't forget that you can re-sort the
list of stocks in the Scan Result Table by
clicking on a column heading (and the sorted
column will display a small triangle in the
column header).
- How to add some stocks to an EXISTING
watchlist? - This is another option in the
drop-down menu. Just select one or more
stocks, and choose "Add to Watchlist" from
the right-click drop-down menu.
|
| More information |
|
|
More details on some of the topics in these
Weekly Tip Sheets are included in Brainy's Monthly
eNewsletters that
are now bundled into Brainy's Share
Market Toolbox Membership privileges.
Feel free to click on the relevant
link at right to view samples and more details.
These bi-weekly Tip Sheets for BullCharts* users
are
intended to be short, quick grabs of
information. They
are not a replacement for the monthly
detailed Brainy's
eNewsletter articles, which cover these
same topics but in much more detail. The
eNewsletters articles also cover Technical
Analysis
and
Share Trading topics.
Also see the BullCharts on-line help (in
BullCharts, hit
the F1 key), and the relevant User Guide
Chapter for
more details (this is supplied with the
software and
copied to your hard drive as a PDF file).
Note: Any screen shots shown in this
newsletter are
snapped from BullCharts version 3.8.4.
FEEDBACK? - I am very keen to receive feedback
about these weekly BullCharts Tipsheets.
Please feel
free to email me with comments, or
suggestions or questions to be answered in a
future Tip Sheet. Contact details are included
below.
* - BullCharts
is: "...an innovative charting and
technical analysis
system. It provides a feature rich and
powerful set of
tools with access to the latest strategies
from local
and overseas authors in analysing the
dynamics of
the
stock market."
|
| This TipSheet might look strange? |
|
|
This TipSheet has been composed in HTML and
distributed using an online service, and is
intended to
be viewed in HTML (ie. web language) format.
Some
parts might look a little strange, especially
if you are
viewing a basically text-only version. I am
working on a
text-only version.
We have also found that some web-mail clients
(eg.
Hotmail and Yahoo mail) can mess up some aspects.
Please feel free to
send me feedback if
anything
looks strange.
Good luck with your trading.
Robert Brain (aka Brainy)
|
|
Seminars - March 2010 |
|
|
|
The next two scheduled seminars are:
They will be
in March
(just a few weeks away) - session details,
dates, costs, venue, etc. are on
my
web site here.
At this stage there are no BullCharts
training workshops
planned (there does not seem to be enough
interest). If you are interested in a topic,
please feel free to contact me to discuss the
options.
The regular venue I now use for most sessions
is the Vermont South Community House.
To enrol for any of these, you need to
contact the
VSCH directly by phone or email.
If you have any questions, please feel
free to email or phone me (or catchup at a
BullCharts User Group meeting, or an ATAA
meeting - I am now the Victorian Chapter
Vice-President, and a National ATAA Board
Member).
|
|