|
Dear Reader,
Welcome to the 17th edition of my
BullCharts software Tip Sheets, focussing on tips and hints for
BullCharts (the Australian charting
software package).
In this Tip Sheet below are
snippets about the latest BullCharts version,
and managing the colours that you can apply
to watchlist items. Including how to change
the default colours.
Last Thursday night at
the monthly
ATAA meeting I delivered a 40-minute
presentation "Technical Analysis - What is it
really?". It was well received, with many
guests in attendance having visited the ATAA
stand at the Melbourne Trading and Investing
Expo the weekend before.
That 40-minute presentation is a cut down
summary version of my 4-hour Technical
Analysis Introduction seminar which I will be
again running again in a few weeks time -
Saturday 7 November at VSCH. More details are
on my web site: www.robertbrain.com.
To make a booking for this event please
contact the Vermont South Community House
(VSCH) directly (see details in column at right).
Don't forget to visit my
Share
Market Toolbox web
site - an arsenal of weapons to help you
tackle the share market.
I am always happy to
receive feedback and
suggestions for these Tip Sheets (and my
Toolbox web site). Or if anything in a Tip
Sheet is not clear, please feel free to
contact me to ask about it (by email or
phone). Or maybe I have made a mistake,
which I will be pleased to correct in the
next Tip Sheet along with an acknowledgement
for whoever spots it first.
Please feel free to
send me feedback, or requests for additional
topics for these Tip Sheets or the
monthly eNewsletter articles.
Good luck with your trading.
Robert ("Brainy") Brain
(Contact details below.)
| Latest BullCharts version - 3.8.4 |
 |
|
The latest version of BullCharts is now 3.8.4.
This is recommended for Windows Vista users,
and for the Windows XP users who have a newer
or faster PC. For less powerful and older
PCs, the BullSystems staff recommend v3.4.1. See the notes on
the BullCharts home page
for details.
This version has fixed some little glitches,
including an improved Alerts feature (this
was new in v3.8.0).
Which version are you running? In BullCharts,
click on the menu options: Help - About
BullCharts.
To get the upgraded version, see the
BullCharts web site, or phone the BullSystems
staff in the Sydney office to discuss.
If you need some help to install a new
version, Robert can be available (for a small
fee).
|
| Colours in watchlists |
|
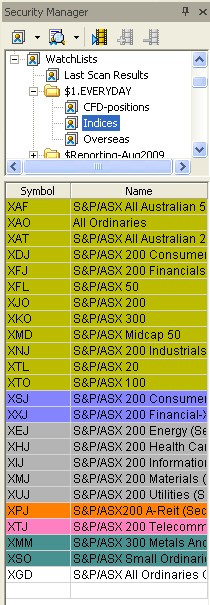
For a couple of BullCharts versions
(since
v3.6.4) we have been able to apply a colour
to individual entries in watchlists (see
accompanying figure).
Why do this?
Firstly, in the sample figure here, I have
colour coded similar market indexes with the
same colours, and then "sort by colour".
(Question: what makes these indexes the
"same" as each other? - In this case, simply
the appearance of the chart at this point in
time. Try viewing a chart of each index and
look for similar performing sectors.)
Secondly, once you do a scan, and you have a
list of scan results, you can peruse a chart
of each stock in the list and quickly mark
the watchlist entry with a colour for a
specific purpose.
For example, your intended purposes might be:
(a) Strong buy signal; (b) Possible buy
signal; (c) Ignore.
Note that you can't change the colour for an
entry in the "Scan Results" list itself. But
this list of stocks is automatically saved in
a watchlist called "Last Scan Results", and
you can change the colours in that watchlist.
You can also change the NAME of this
watchlist and move it into a watchlist FOLDER.
To change the colour of a watchlist item,
simply right-click on the entry and choose
"Select colour" from the drop-down menu
(sometimes you might need to wait 10 or 15
seconds for the drop-down menu to appear -
just be patient).
|
| Watchlists - Sort sequence |
|
|
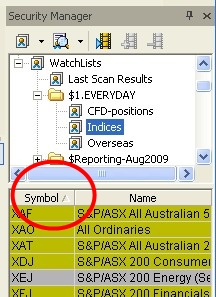
With any watchlist, you can sort the
stocks
in that list by Symbol, Name or Colour.
Simply right-click on the watchlist (or on
the "header" bar of the watchlist) and choose
"Sort Order", and select the desired item to
sort on.
Don't forget, you also can reverse the
sequence of the sort - in reverse Name
sequence, or reverse Symbol sequence, etc. -
simply left-click once on the "column header"
in the watchlist.
If you sort by Symbol or Name, then a small
triangle will appear in the column header to
indicate which column is the sort-column. And
the triangle will point either up or down
depending on the sort sequence.
|
| Default Colours and Sort sequence |
|
|
You can change the available colours
for the
watchlist entries. You can also change the
default sort order for new watchlists.
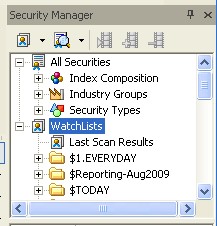
To do this you need to change the default
values for the "Watchlist Folder Properties".
First, right-click on the "Watchlists" entry
in the Watchlists (Security Manager) window
(see accompanying figure) and select
"Properties" from the drop-down list, and
then the "Sort Order" tab. The "Watchlist
Folder Properties" dialogue box will open
(see below).
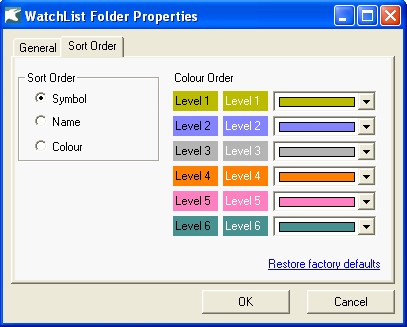
In this dialogue box you can change the
default sort sequence for all watchlists, and
you can change the colours that are to be
applied.
|
| More information |
|
|
More details on some of the topics in these
Weekly Tip Sheets are included in Brainy's
Monthly
eNewsletters that are now bundled into Brainy's
Share
Market Toolbox Membership privileges. Feel free to
click on the relevant link at right to view samples and more details.
These weekly Tip Sheets for BullCharts* users
are intended to be short, quick grabs of
information. They are not a replacement for the monthly
detailed Brainy's eNewsletter articles, which cover these same topics
but in much more detail. The eNewsletters articles also cover Technical
Analysis and Share Trading topics.
Also see the BullCharts on-line help (in
BullCharts, hit the F1 key), and the relevant User Guide
Chapter for more details (this is supplied with the
software and copied to your hard drive as a PDF file).
Note: Any screen shots shown in this
newsletter are snapped from BullCharts version 3.8.2.
FEEDBACK? - I am very keen to receive feedback about these weekly
BullCharts Tipsheets.
Please feel free to email me with comments, or
suggestions. Contact details are included
below.
* - BullCharts
is: "...an innovative charting and
technical analysis system. It provides a feature rich and
powerful set of tools with access to the latest strategies
from local and overseas authors in analysing the
dynamics of the stock market."
|
| This TipSheet might look strange? |
|
|
This TipSheet has been composed in HTML and
distributed using an online service, and is
intended to be viewed in HTML (ie. web language) format. Some parts
might look a little strange, especially
if you are viewing a basically text-only version. I am
working on a text-only version.
We have also found that some web-mail clients
(eg. Hotmail and Yahoo mail) can mess up some aspects.
Please feel free to send me feedback if
anything looks strange.
Good luck with your trading.
Robert ("Brainy") Brain
|
|
|
Technical
Analysis Introduction seminar - 7 Nov
|
|
|
|
Here's a quick quiz for you.
Technical Analysis is a very broad subject. How much do you know about
each of the
following topics? A basic understanding? or
a more detailed knowledge?
- Dow Theory and Efficient Market
Hypothesis
- Trend lines
- Support and Resistance
- Volume
- Price charts
- Chart patterns
- Price breakouts
- Indicators (lots)
- Fibonacci
- Trading intro
- Stop Loss
At the 4-hour Technical Analysis Introduction
seminar I am running on Saturday 7 November,
I will
give you a really good broad understanding of
what Technical Analysis is all about.
The above list is just a short version of the
seminar topics that we cover. Complete with
hand-out notes with all the detail.
More information including details on how to
register are on my
web site here.
The seminar venue on this occasion is Vermont
South Community House.
To enrol for any of these, you need to
contact the
VSCH directly by phone or email. If you
have any questions about these, please feel
free to email or phone me (or catchup at a
BullCharts User Group meeting, or an ATAA
meeting).
|
|