|
Dear Reader,
Welcome to the 10th edition of my (fortnightly)
BullCharts software Tip Sheets, focussing on tips and hints regarding
the Australian BullCharts charting software package.
I am happy to receive feedback and suggestions for these Tip Sheets.
Which version of BullCharts are you running? We are now up to version
3.8.1. The last couple of updates over the last year or two (version
3.6, and 3.8) have included some nice new features. See more details
below.
Over the last 2+ years that we have been running the BullCharts User
Group meetings in Melbourne, there have been a lot of tips and hints
discussed by user group members around the table. And people often ask
"how can I do xx in BullCharts?". I am including some of those tips in
these Tip Sheets. Of course, if you attend the meetings then you also
get to here a lot of other information about the market, trading
strategies, and various seminars and books that people have
encountered.
In this Tip Sheet edition I cover a couple of BullCharts tips from
recent User Group meetings including: how to display currencies, and
how to show two stocks on the one price chart - as you would with
studying prices for pairs trading (from the Feb 2009 meeting). Pairs
Trading was discussed by the TCT staff in the Trading Blox presentation
at the last meeting.
Also, the next edition of my monthly e-Newsletter is due out in the
next week. The Share Market topic will be an introduction to the
strategy topic of correlation (of stocks, indices, markets). You can click here for more details
about Brainy's Monthly eNewsletter articles (on Technical Analysis,
Share Trading and BullCharts), and to view all the articles in the
first one, or a preview of each month's articles.
Please feel free to send me feedback, or
requests for additional topics .
Good luck with your trading.
Robert ("Brainy") Brain
(Contact details below.)
Topics in this week's Tip Sheet: |
 |
|
TCT
Strategy Session - 25th March in Brisbane
BullCharts
version 3.8.1 (beta)
Show
Axis - Left, or Time
Display
currencies
Chart
two stocks together (or indices or currencies)
More
information
This
TipSheet might look strange?
|
| BullCharts version 3.8.1 (beta) |
|
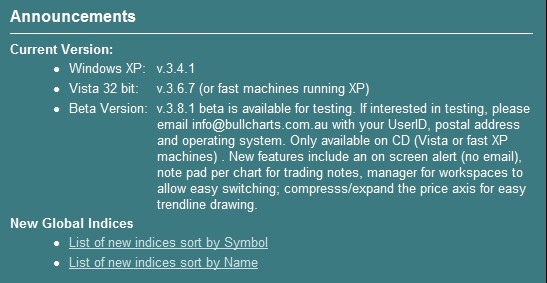 If you look at the BullCharts
web site home page, there is a brief list of the latest
Announcements. This includes a note about the Current Versions of
BullCharts. And today the note there says that version 3.8.1 (beta) is
available. There are also some instructions there on how to get this
latest version.
This latest version 3.8.1 is being referred to as a "beta", but that is
just because it has not yet received very thorough absolute testing. It
is basically a warning that there might still be a bug in the product.
But I would not worry about this. I have been running v3.8.0 since
about last October (as an official BullCharts user tester). And I have
been running 3.8.1 for a couple of weeks now. I am very happy with the
product, and the new features.
Just briefly, v 3.8.x includes a couple of nice features including: a
"Workspace Manager" to manage your BullCharts Workspaces. If you are
not sure about Workspaces, then stay tuned for the next Tip Sheet where
I will cover it in detail, including the v3.8.1 aspects.
Other new features include Price Alerts. That is, you can set a price
point on a price chart, so that BullCharts will alarm after the price
is reached. This is very useful for end of day, or weekly,
traders/investors. Intraday traders can also use this feature by
downloading data snapshots during the day, and scanning for alerts
based on the latest snapshot.
|
| Show Axis - Left, or Time |
|
 Sometimes it can be useful to display
a price axis on the left-hand side of the price chart. By default, this
is not displayed.
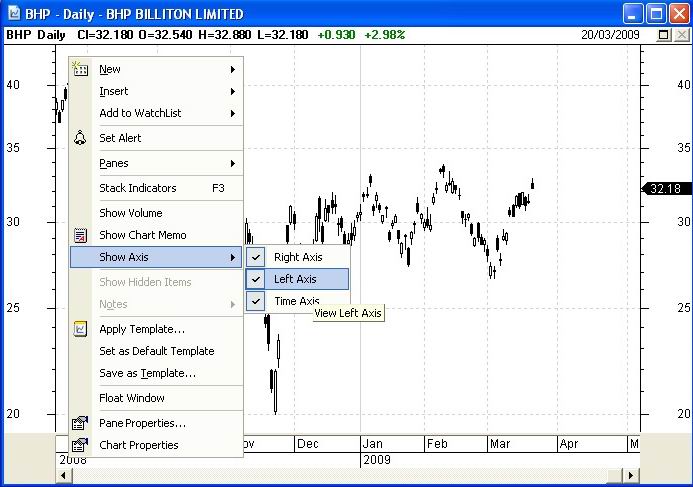
Right-click the mouse anywhere around the middle of the price chart -
not over the top of an axis.
>From the drop-down menu choose "Show Axis" (see the
accompanying screen shot, and click on the diagram for a larger image).
Select, or deselect, any of the options listed.
Note that the left price axis that is now displayed shows the same
price values as on the right hand axis. This is to be expected when you
are displaying only one stock. I find this useful on a larger screen
where I am studying price action to the left of the chart. But when you
display more than one stock (or index or currency), you can display a
different scale of values on one axis compared to the other.
Note that one of the options here is to uncheck the Time Axis option,
so that the time axis is not displayed. Now you might not be able to
think of any reason why you might do this; but the option is there.
|
| Display currencies |
|
 It is possible to display a number of
"currency pairs" in BullCharts (17 at last count). Don't forget that
when we talk about trading currencies, we are talking about a "currency
pair". That is, one currency compared to another; eg. the Australian
Dollar and US Dollar.
This question came up in last month's Melbourne User Group meeting, and
we demonstrated how to do this.
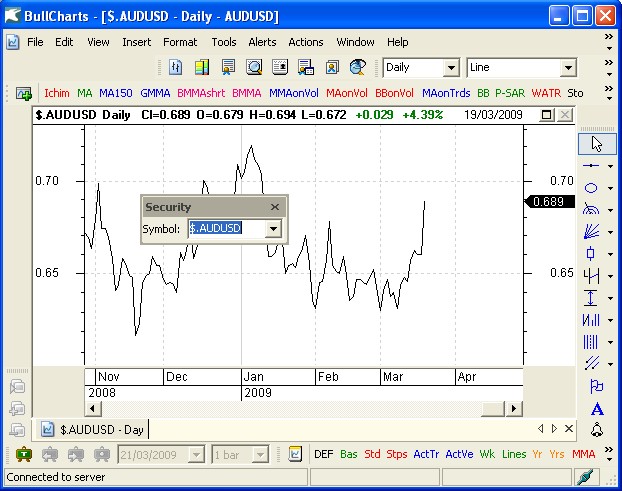
To display this currency pair in BullCharts, make sure the "Security"
toolbar is displayed. When it is not docked with other toolbars around
the edge of the BullCharts window, it looks like as in the accompanying
screen shot. If this is not displayed anywhere around your BullCharts
window, then check on the menu option: View > Toolbars, and see
whether the "Security" toolbar option is ticked.
While you are checking this, have a quick look at the many other
toolbars that are available. It is easy to tick and untick any of these
just to see what they are.
In the Security toolbar field, type in the characters: $.AUDUSD and hit
the enter key. It might take a moment, because this data is not stored
on your computer, so the BullCharts software needs to send a request
over the internet to the web site to get the data, and bring it back to
display it.
For a list of other currency pairs, see the BullCharts Help. You can
hit the F1 key in BullCharts, then type currencies
in the Search field (not the Index field). It should display a list of
17 currency pairs.
BTW - Notice that the "Security" toolbar field is actually a
"drop-down" so that you can see a list of recently viewed securities.
The number of securities that are displayed in this list can be
adjusted - see the menu option: Tools > Preferences >
General (tab) and the option "Number of recent
symbols". I have mine set to 30.
|
| Chart two stocks together (or indices or currencies) |
|
There are situations where you might want to
display two stocks on the one price chart.
For example, you might want to compare the price performance of two
banks, and buy the bank that is currently the weaker of the two on the
assumption that over the long term they will become similar. That is,
you might want to buy the bank that has been under performing the
other. (WARNING - This is not a guaranteed strategy, and is not
recommended without thorough testing.)
This is a topic known as correlation and pairs trading, where you do
some research to see how well two similar stocks perform when compared
to each other over the very long term. If your research shows that two
particular stocks do correlate each other over the long term, then you
might take on the view that they are closely correlated. In which case
you might then "pair trade" these two stocks. If you are interested in
this topic you should study it some more before implementing such a
strategy.
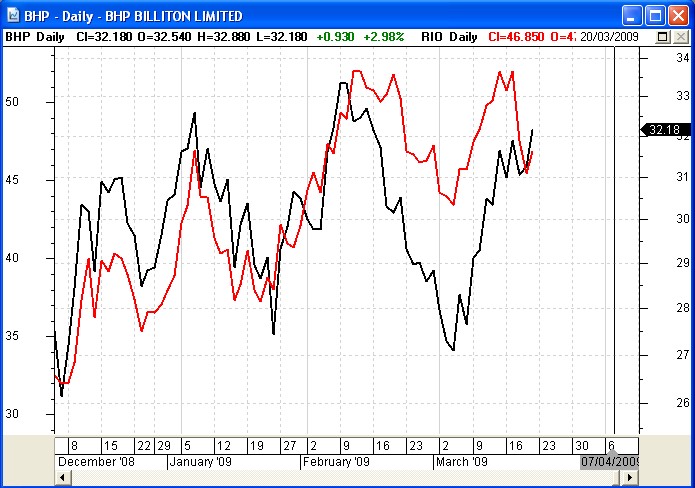
Now, let's say you have correlated two big mining stocks like BHP and
RIO. The accompanying chart shows these two stocks over a few months
from December 2008 to late March 2009.
To get a chart with two stocks, firstly display one price chart (eg.
BHP). Then from the BullCharts menu use: Insert > Security (or
hit Ctrl E on the keyboard). In the dialogue box to enter the second
security, carefully note all of the following options:
- Parameters tab - the Symbol (ie.
security or stock code which can be in index like the XJO, or a global
index like "US.^DJA", or a currency pair). Also the Period - you can
put a Weekly chart onto a Daily, for example.
- Style tab - Note the Plot type -
you can have one plot as a Line and one as Candles. And you can change
Line Thickness for a contrast between the two price charts.
- Location tab - By default, this
second security will want to go into a New Pane. If you really want it
overlaid on top of the first security, then you need to select that
price pane here.
- Colour tab - You can change the
"Colour Method" (fiddle with this if you are not sure what it does),
and also the Colour of the Security. A different colour will help it
stand out. In the sample chart shown, BHP is in black, and the second
security (RIO) is shown in red.
- Scale tab - This is important if
the two securities being charted have different price ranges, as with
the BHP and RIO sample here. BullCharts always displays the price of
your first security on the right-hand price axis. When inserting a
second security, it is wise to select the option "Display new scale on
left". But, do note the other options on this list, including
"Spread...", and "Relative Strength Comparison".
In the sample price chart shown here, note the
following features:
- BHP is shown in black, and RIO in red.
- Left-hand price axis is RIO, and
right-hand is BHP.
- In the title bar across the top of
the chart, BHP is named first along with its C-O-H-L price details (as
it was the first security I displayed, and RIO was "inserted" on the
BHP price chart). The details in green "+0.930 +2.98%" are the price
change since the previous bar in dollars and
percentage. As it is a daily chart, these are the changes since
yesterday's Close.
- Along the right of the title bar,
RIO is named, and its C-O-H-L price details in the colour that matches
its price chart (in red).
- Unfortunately, BullCharts cannot at
this stage set the two price charts to be exactly on top of each other
at a specific date. What it does do is simply fit the two charts as
best as possible into the chart window - this is something that
BullCharts is good at. So, be careful when looking at the actual price
range of the two securities. You can see on this chart that BHP is
ranged from about $27 to $33.50 (about $6.50) while Rio has ranged from
about $32 up to about $52 (about $20). So just keep this in
perspective. It would be good if both could be set to the same "range"
with just an offset for one of them.
|
| More information |
|
|
More details on some of the topics in
these Weekly Tip Sheets are included in Brainy's Monthly eNewsletters that
are available to subscribers (for a very modest amount). Feel free to
click on the relevant link at right to view samples and more details.
These weekly Tip Sheets for BullCharts* users are intended to be short,
quick grabs of information. They are not a replacement for the monthly
detailed Brainy's eNewsletter articles, which cover these same topics
but in much more detail. The eNewsletters articles also cover Technical
Analysis and Share Trading topics.
Also see the BullCharts on-line help (in BullCharts, hit the F1 key),
and the relevant User Guide Chapter for more details (this is supplied
with the software and copied to your hard drive as a PDF file).
Note: Any screen shots shown in this newsletter are snapped from
BullCharts version 3.8.
FEEDBACK? - I am very keen to receive feedback about these weekly
BullCharts Tipsheets. Please feel free to email me with comments, or
suggestions. Contact details are included below.
* - BullCharts is: "...an
innovative charting and technical analysis system. It provides a
feature rich and powerful set of tools with access to the latest
strategies from local and overseas authors in analysing the dynamics of
the stock market."
|
| This TipSheet might look strange? |
|
|
This TipSheet has been composed in
HTML and distributed using an online service, and is intended to be
viewed in HTML (ie. web language) format. Some parts might look a
little strange, especially if you are viewing a basically text-only
version. I am working on a text-only version.
We have also found that some web-mail clients (eg. Hotmail and Yahoo
mail) can mess up some aspects.
Please feel free to send me feedback
if anything looks strange.
Good luck with your trading.
Robert ("Brainy") Brain
|
|
|
TCT Strategy Session - 25th March in Brisbane
|
|
|
|
How to maximise profit and reduce risk in today's
market environment.
TCT Australia is a company I work with in supporting traders and
investors with various training courses, seminars and workshops. They
recently ran a 3-hour workshop in Melbourne in early March (on a
Wednesday evening) on the topic of Correlation and strategy. And there
is a Strategy session taking place in Brisbane next
Wednesday evening 25th March.
Find out how people like you, perhaps with limited knowledge about the
world markets, are BUILDING WEALTH and beating the "professionals" at
their own game!
- Learn about a simple, low risk, low
effort market strategy.
- See a system that is up 80% in the
current market.
- Find out how to build a LOW RISK,
market beating Portfolio.
- And it applies to all levels of
understanding - novice and advanced.
Visit this web page for more details and to
register.
Or you can register to receive free Trading Videos and the TCT
Newsletters, and find out first hand about future workshops in
Melbourne and other locations around Australia. See the general TCT web
site link below for details.
TCT Australia specialises in providing training and mentoring to
traders. Their best selling product is the Live Trader Program (LTP),
which includes some theoretical online video training, and 5 days of
hands-on realistic and mentored trading practise in their trading room
(using a practise trading account with $100,000 of play money).
Feel free to contact me for further details about this program. Or talk
with the TCT staff, and tell them you heard about the program from
Robert Brain. If you are keen to do the LTP program; but the price
might be a stumbling block, then call me and we can talk about the
possibilities.
|
|