|
Dear
Reader,
Welcome to the 5th edition of my weekly
BullCharts software Tip Sheets, focussing on tips and hints relating to
the use of the Australian BullCharts charting software package.
Firstly, let me observe that the markets finished the week at a new
Lower Close (XAO 3300); but not lower than the XAO intraday Low of 3201
on 21 Nov 2008. Many technical analysts are now saying that the last
"recent" technical support level is breached, and that the market is
heading down to make a new much lower low. The next major support level
is back in either 1999, 2001, or 2003. The target value could be in the
range of 2796 to 2927, or as low as 2666 (from 13/3/2003). (Please
remember that I am not a licensed financial advisor, so I do not
comment on the market and I do not provide any sort of financial or
investing advice. The words here are my own thoughts, just thinking out
loud.)
Some of the Elliott Wave enthusiasts are now also confirming their
earlier comment that the next big and severe downward wave is under
way. It's target price point and time frame depends on your wave count,
and your Gann interpretation.
Enough on the market. Let's get on with this week's BullCharts Tip
Sheet. This week I am extending the information from last week on scans
in BullCharts, and covering very specific information on the "Scan
Criteria" topic. For introductory information, or other BullScan
details, please see last week's Tip Sheet (in my web site archive - see
the link below) or my Monthly Brainy's eNewsletter articles.
Please feel free to send me feedback, or requests for additional
topics.
Topics in this week's newsletter: |
 |
|
Advanced
trading topics - SPI Gap Filler strategy
BullCharts
scans - "2. Scan Criteria"
"First
Value to Compare > Category > price or chart field"
"First
Value to Compare > open/high/etc?"
"Type of
Comparison"
More
information
This
TipSheet might look strange?
|
| BullCharts scans - "2. Scan Criteria" |
|
|
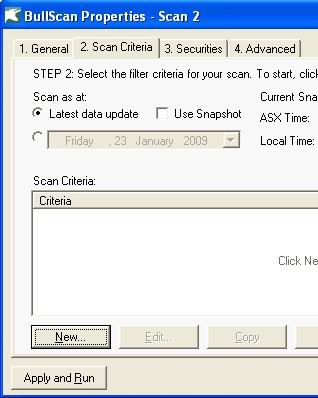
In BullCharts, if you open an existing
Scan or create a new Scan, there are four tabs in the BullScan
Properties dialogue box. One of these tabs is "2. Scan Criteria". This
is where you can specify a number of "things" (or properties) about the
scan, to define which stock market data we will search through, and in
which time period, and which time frame, as well as the individual
"stock selection" (or "scan") criteria.
To create a new Scan Criteria, simply click on the "New..." button near
the bottom of the dialogue box.
In the notes below, we take a quick look at just some of the available
selection criteria. I will cover other options in future editions of
Brainy's Tip Sheets.
|
| "First Value to Compare > Category >
price or chart field" |
|
|
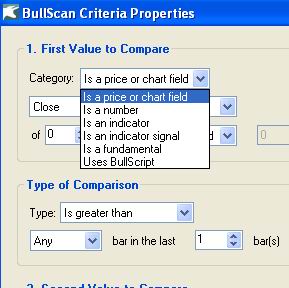
In the BullScan Properties dialogue
box, if you click on the "New..." button to create a new Scan Criteria,
the top portion of the next dialogue box ("BullScan Criteria
Properties") looks like the figure here. If you view the details of the
"Category" drop down, you will see there are six different types of
values that we can use for comparison.
In the text here we will only talk about the first option - "Is a price
or chart field". But, note the other options, including: "Is an
indicator", and "Is a fundamental". I will cover those in future Tip
Sheets.
|
| "First Value to Compare > open/high/etc?" |
|
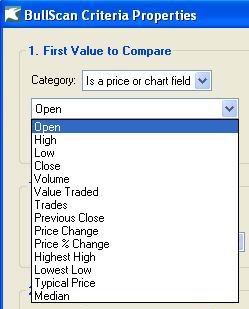 If you choose "Is a price or chart
field" as the First value to compare (as described above), then you
have 14 different choices for the next drop-down (see the accompanying
figure).
The most commonly used ones include: Open, High, Low, Close and Volume.
But note there is also: "Value Traded" (ie. the dollar value), so that
you might choose only stocks with more than, say, $100,000 traded in a
day, or perhaps $500,000 in a week.
Also "Trades" (ie. the number of buy/sell transactions in the period -
day or week). You might want to choose only the stocks that have had
more than, say, 50 trades in a day (or 250 in a week). This will help
you avoid thinly traded stocks. If you want to exit the stock in a
hurry, there needs to be enough liquidity.
NOTE: If you have these criteria for stock selection, then they must be
recorded in your written version of your Trading Strategy (see Brainy's
Monthly eNewsletter articles for more details).
Also note these options: "Previous Close", "Price Change", and "Price %
Change". These help to compare a Close price to the previous close, or
to look at the actual change in price compared with a Close price at
some stage in the past - either in dollars, or percentage change. In
the latter case, you might want to search for a stock that has changed
by, say, 10% over a 5-day period.
Two other useful ones are "Highest High" and "Lowest Low". You can use
these to look for a situation over, say, an 8-bar period, or maybe 21
or 34 bars. If a stock is making Higher Highs, then perhaps an uptrend
is confirmed?
The last two on the list are "Typical Price", and "Median". More about
these in a future article.
|
| "Type of Comparison" |
|
|
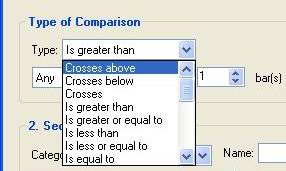
Having chosen the "Price or Chart
field" option, and then a specific item, you can choose the "Type of
Comparison" to make. Remember that further down in the dialogue box is
the "2. Second Value to Compare" option. So the "Type of Comparison"
will compare the "First value..." with the "Second Value...". Depending
on how you think, sometimes it is useful to do it in this sequence:
- Set the "First Value to
Compare...", then
- Set the "Second Value to
Compare...", then
- Go back and set the "Type of
Comparison".
Just some of the different types of comparisons that are available are
shown in the accompanying diagram. There are actually 23 in all. A
useful and little known one is "Show this value", so that you can
specify an indicator or price field, and simply "Show it" in the scan
results table. In this situation, the "2. Second value to Compare"
options are greyed out and not available.
Other useful values to "Show" include some of the 20 "Fundamental"
values: Total Issue, EPS, PE, Dividend yield, Dividend date, etc.
There are far too many options here to cover in detail in these short
Tip Sheets, so they will be covered in more detail in Brainy's Monthly
eNewsletter articles.
IMPORTANT NOTE: If you are comparing two price or chart fields, then
there is something important to note about the "Type of Comparison".
There are two more drop-down boxes: "Any/Every", and the number of bars
for comparison. If the number of bars is set to one, then the Any/Every
drop-down box is ignored. So it does not matter whether you specify
"Any" or "Every". This can be a source of confusion for someone trying
to understand how all this works.
|
| More information |
|
|
More details on scans and how to create and
customise them are included in Brainy's Monthly eNewsletters that are
available to subscribers (for a very modest amount). Feel free to click
on the relevant link at right to view samples and more details.
These weekly Tip Sheets for BullCharts* users are intended to be short,
quick grabs of information. They are not a replacement for the monthly
detailed Brainy's eNewsletter articles, which cover these same topics
but in much more detail. The eNewsletters article also cover Technical
Analysis and Share Trading topics.
Also see the BullCharts on-line help (in BullCharts, hit the F1 key),
and the relevant User Guide Chapter for more details (this is supplied
with the software and copied to your hard drive as a PDF file).
Note: Any screen shots shown in this newsletter are snapped from
BullCharts version 3.8 (which will be available very soon).
FEEDBACK? - I am very keen to receive feedback about these weekly
BullCharts Tipsheets. Please feel free to email me with comments, or
suggestions.
* - BullCharts
is: "...an innovative charting and technical analysis system.
It provides a feature rich and powerful set of tools with access to the
latest strategies from local and overseas authors in analysing the
dynamics of the stock market."
|
| This TipSheet might look strange? |
|
|
This TipSheet has been composed in
HTML and distributed using an online service, and is intended to be
viewed in HTML (ie. web language) format. Some parts might look a
little strange, especially if you are viewing a basically text-only
version. I am working on a text-only version.
We have also found that some web-mail clients (eg. Hotmail and Yahoo
mail) can mess up some aspects.
Please feel free to send me feedback if anything looks strange.
|
|
|