In the
share market, any stock or index
will be trading in one of 3 "ways":
- in an up trend,
or
- in a down trend,
or
- there will be no
trend,
and this can apply in 3 time frames.
See the Members'
Area of the
Share Market Toolbox for much more detail.
Why is this important? Well if we can spot a rising trend, and buy
into the trend, we should be able to ride the trend for a profit. The
stronger the trend, and healthier the trend, then the greater the
chances of longer term and better profitability.
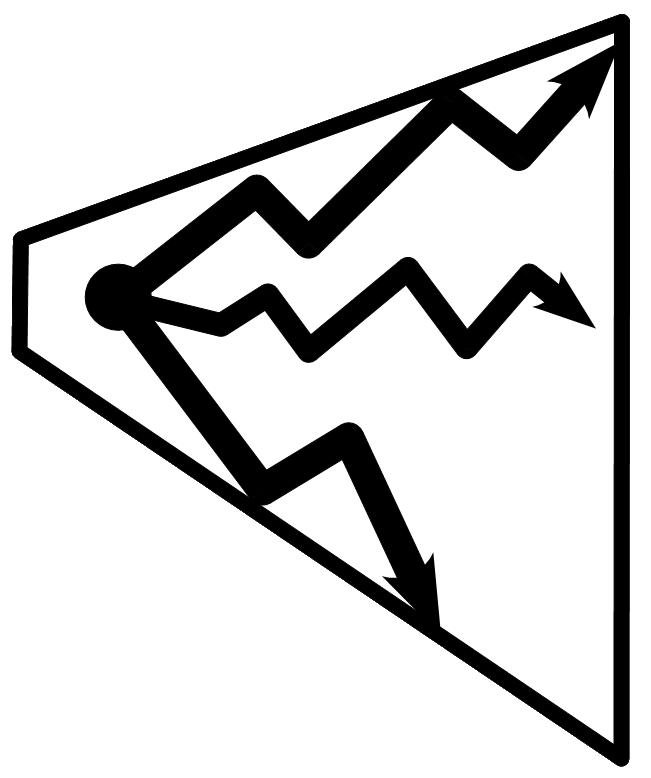
The symbol at right represents
the "3Ways" Rule. Note the following:
- The upper zig zag line represents the simple uptrend
- higher highs and higher lows.
- The lower zig zag line represents the simple downtrend
- lower highs and lower lows.
- The middle zig zag line represents the
non-trending price chart, where there is not a clear trend in place.
- Notice that the downtrend line has dropped
further than the uptrend line has risen, and in a shorter time. [Up
by the stairs, down by the elevator.] In mathematical terms,
this would be described as a steeper gradient.
- In the diagram, this pattern is enclosed in a
triangle shape with the tip cut off (technically it is a trapezoid, but
we won't let that bother us). On price charts you will from time to
time see various triangle shapes, but flipped with the pointy end to
the right. The triangle chart pattens deserve a whole lot of separate
discussion.
- The triangle shape shown here is more like a
megaphone chart pattern, or broadening wedge. A pattern that is not
very common on price charts, but which does exist.
For more details
about the 3Ways Rule in 3Times, see the Members'
Area of the Share Market Toolbox - you will need
to use your
Share Market Toolbox Member username and password - if not a Toolbox Member, consider
joining now.
|
The
"3Ways Rule" symbol
(basic version)

See the Members'
Area of the Toolbox
for a lot more detail, including
the complete coloured version and
explaining all the elements
of this symbol.
As well as the relationship to Dow Theory. |